empty
31.01.2023 11:32 AM
EUR/USD and GBP/USD technical analysis on January 31, 2023

EUR/USD

This image is no longer relevant

Higher time frames

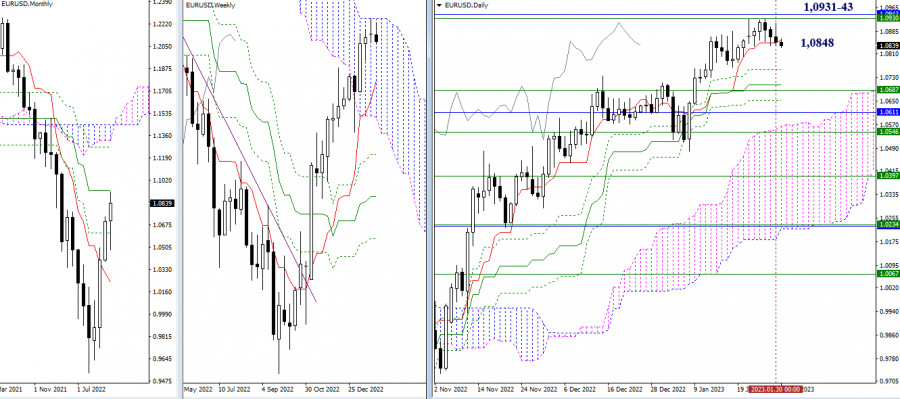
The situation has not changed much over the past 24 hours. The pair is still holding near the support level of the daily short-term trend (1.0848). Consolidation below this level and a further decline will bring the price to the lower levels of the daily Ichimoku Cross at 1.0759 – 1.0706 – 1.0653 and the weekly short-term trend at 1.0687. The bearish scenario is more likely in current conditions for various reasons. If bulls return to the market at some point, their main target will be the key resistance of 1.0931-43 (upper boundary of the weekly Ichimoku Cloud + monthly medium-term trend).

This image is no longer relevant

H4 – H1

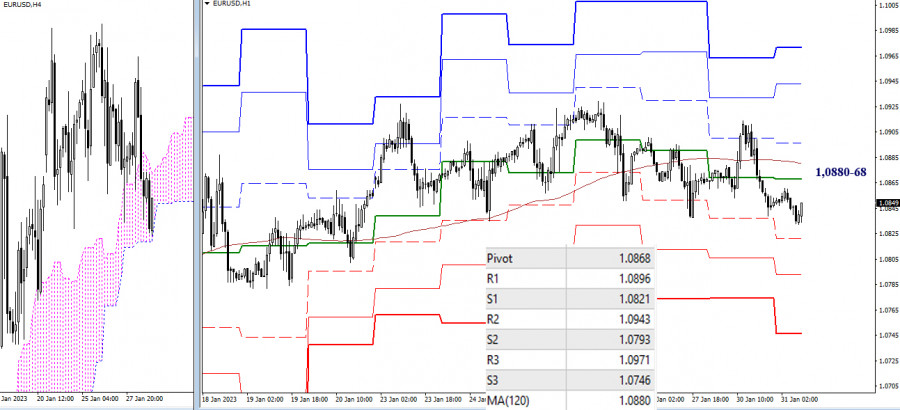
Bears are taking over the pair on lower time frames. The pair is currently trading below the central pivot level of 1.0868 and the weekly long-term trend of 1.0880. The next downward targets on the intraday chart are found at the support of standard pivot levels of 1.0821 – 1.0793 – 1.0746. A breakout of the Ichimoku Cloud on H4 and consolidation in the selling zone will support the bearish trend and will send the price for a new breakout.

***

GBP/USD

This image is no longer relevant

Higher time frames

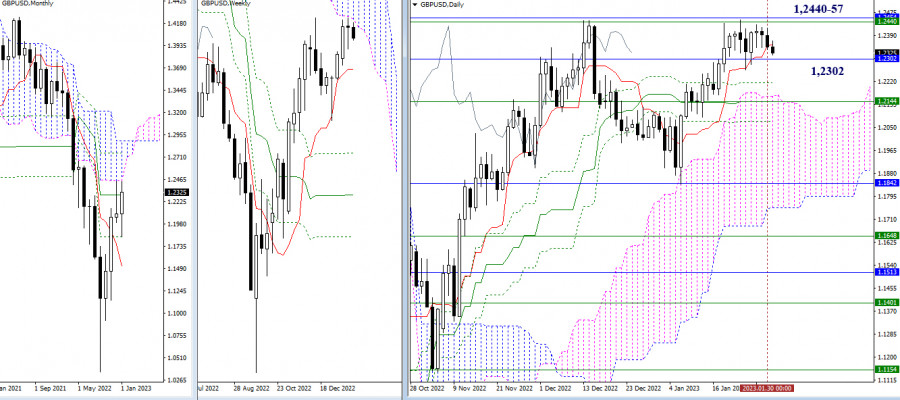
The daily short-term trend has slightly shifted from the level of 1.2302. The pair is still trading in the range between 1.2457-40 (upper boundaries of Ichimoku Clouds on monthly and weekly time frames) and 1.2302 (monthly medium-term trend). If the price leaves these boundaries, it may develop a new trajectory.

This image is no longer relevant

H4 – H1

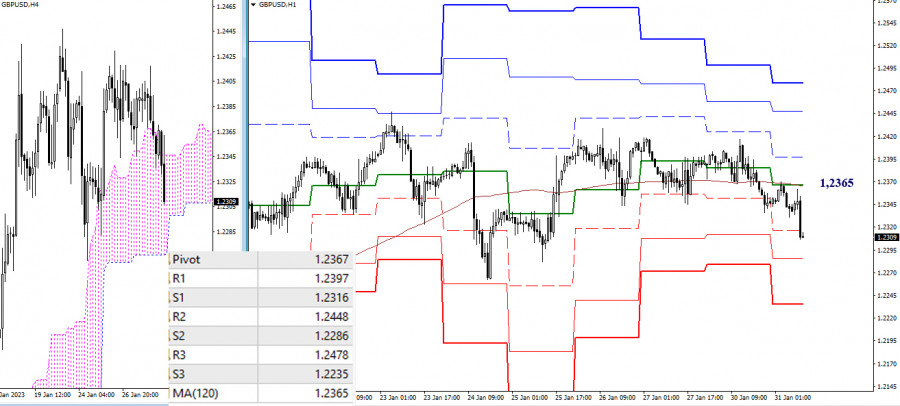
On lower time frames, the price has slipped below the key levels found at 1.2367-65 (central pivot level + weekly long-term trend). Trading below this range will support the sellers. Other intraday targets for bears are located at standard pivot levels of 1.2286 and 1.2235 as well as at the lower boundary of the cloud on H4. If the price settles outside the H4 cloud, it may head lower for new downward targets.

***

Technical analysis is based on:

Higher time frames – Ichimoku Kinko Hyo (9.26.52) + Fibo Kijun levels

Lower time frames – H1: Pivot Points (standard) + 120-day Moving Average (weekly long-term trend)

Evangelos Poulakis,
الخبير التحليلي لدى شركة إنستافوركس
© 2007-2025
حدد الإطار الزمني
5
د
15
د
30
د
1
س
4
ساعات
1
يوم
1
أسبوع
كسب عائد من تغيرات أسعار العملات المشفرة مع إنستافوركس.
قم بتحميل منصة التداول ميتاتريدر 4 وافتح أول صفقة.
  • Grand Choice
    Contest by
    InstaForex
    InstaForex always strives to help you
    fulfill your biggest dreams.
    انضم إلى المسابقة

المقالات الموصى بها

التحليل الفني لحركة السعر اللحظية لأزواج العملات المتقاطعة AUD/JPY، الأربعاء، 23 أبريل 2025.

مع ظهور تباين بين حركة سعر زوج العملات المتقاطع AUD/JPY مع مؤشر مذبذب ستوكاستيك وحركة سعر AUD/JPY التي تقع فوق المتوسط المتحرك المرجح (30 إزاحة 2) والذي لديه أيضًا

Arief Makmur 06:37 2025-04-23 UTC+2

التحليل الفني لحركة السعر اليومية لأداة سلعة الذهب، الأربعاء، 23 أبريل 2025.

إذا نظرنا إلى الرسم البياني لمدة 4 ساعات، يبدو أن أداة السلع الذهبية لا تزال تتحرك في اتجاه صعودي، ولكن مع ظهور تباين بين حركة سعر الذهب ومؤشر مذبذب ستوكاستيك،

Arief Makmur 06:37 2025-04-23 UTC+2

توقعات الفوركس 22/04/2025: اليورو/الدولار الأمريكي، الجنيه الإسترليني/الدولار الأمريكي، الدولار الأمريكي/الين الياباني وبيتكوين

روابط مفيدة: مقالاتي الأخرى متوفرة في هذا القسم دورة InstaForex للمبتدئين التحليلات الشائعة افتح حساب تداول مهم: يجب على المبتدئين في تداول الفوركس أن يكونوا حذرين للغاية عند اتخاذ القرارات

Sebastian Seliga 10:08 2025-04-22 UTC+2

التحليل الفني لحركة السعر اللحظية لأزواج العملات المتقاطعة GBP/CHF، الثلاثاء 22 أبريل 2025.

إذا نظرنا إلى الرسم البياني لمدة 4 ساعات لزوج العملات المتقاطع GBP/CHF، نجد عدة حقائق مثيرة للاهتمام. أولاً، ظهور نمط المثلث متبوعًا بحركة المتوسط المتحرك الأسي (21) الذي يتحرك

Arief Makmur 06:58 2025-04-22 UTC+2

التحليل الفني لحركة السعر اللحظية لأزواج العملات المتقاطعة AUD/CAD، الثلاثاء 22 أبريل 2025.

مع حركة سعر زوج العملات المتقاطع AUD/CAD فوق المتوسط المتحرك الوزني (WMA) لفترة 21 والذي يميل إلى الصعود وظهور التقارب بين حركة سعر AUD/CAD ومؤشر المذبذب العشوائي، فإن ذلك يعطي

Arief Makmur 06:58 2025-04-22 UTC+2

إشارات التداول للذهب (XAU/USD) للفترة من 21 إلى 25 أبريل 2025: البيع تحت مستوى 3,422 دولار (مستوى تشبع الشراء - 8/8 Murray)

وصل مؤشر النسر إلى مستويات الشراء المفرط. ومع ذلك، يمكن أن يصل المعدن إلى الارتفاع حول 8/8 Murray، والذي يمثل حاجزًا قويًا للذهب. أسفل هذه المنطقة، قد تكون لدينا

Dimitrios Zappas 17:23 2025-04-21 UTC+2

التحليل الفني لحركة السعر اللحظية لأزواج العملات المتقاطعة EUR/GBP، الاثنين 21 أبريل 2025

من خلال ما يظهر على الرسم البياني لمدة 4 ساعات، يبدو أن زوج العملات المتقاطع EUR/GBP يتحرك فوق المتوسط المتحرك الأسي (100)، مما يشير إلى أن المشترين يسيطرون

Arief Makmur 04:19 2025-04-21 UTC+2

التحليل الفني لحركة السعر اللحظية لأزواج العملات الرئيسية USD/JPY، الاثنين 21 أبريل 2025.

مع ظهور التقارب بين حركة سعر زوج العملات الرئيسي USD/JPY مع مؤشر Stochastic Oscillator وموقع EMA (100) الذي يقع فوق السعر، فإن زوج USD/JPY لديه إمكانية لمواصلة ضعفه في المستقبل

Arief Makmur 04:19 2025-04-21 UTC+2

توقعات الفوركس 18/04/2025: اليورو/الدولار الأمريكي، الجنيه الإسترليني/الدولار الأمريكي، الذهب والبيتكوين

روابط مفيدة: مقالاتي الأخرى متوفرة في هذا القسم دورة InstaForex للمبتدئين التحليلات الشائعة افتح حساب تداول مهم: يجب على المبتدئين في تداول الفوركس أن يكونوا حذرين للغاية عند اتخاذ القرارات

Sebastian Seliga 10:18 2025-04-18 UTC+2

الذهب: استمرار حالة عدم اليقين يدعم أسعار الذهب

تستمر أسعار الذهب في تلقي الدعم وسط ضبابية عدم اليقين المحيطة بمسار الحروب الجمركية التي بدأها دونالد ترامب. لقد ارتفعت أسعار الذهب بشكل شبه عمودي لمدة أربعة أشهر. المحرك الرئيسي

Pati Gani 11:49 2025-04-17 UTC+2
لا تستطيع التحدث الآن؟
اطرح سؤالك في الدردشة.
Widget callback
 

Dear visitor,

Your IP address shows that you are currently located in the USA. If you are a resident of the United States, you are prohibited from using the services of InstaFintech Group including online trading, online transfers, deposit/withdrawal of funds, etc.

If you think you are seeing this message by mistake and your location is not the US, kindly proceed to the website. Otherwise, you must leave the website in order to comply with government restrictions.

Why does your IP address show your location as the USA?

  • - you are using a VPN provided by a hosting company based in the United States;
  • - your IP does not have proper WHOIS records;
  • - an error occurred in the WHOIS geolocation database.

Please confirm whether you are a US resident or not by clicking the relevant button below. If you choose the wrong option, being a US resident, you will not be able to open an account with InstaForex anyway.

We are sorry for any inconvenience caused by this message.