empty
05.12.2023 03:34 PM
BITCOIN: Technical analysis of the situation

This image is no longer relevant

Higher timeframes

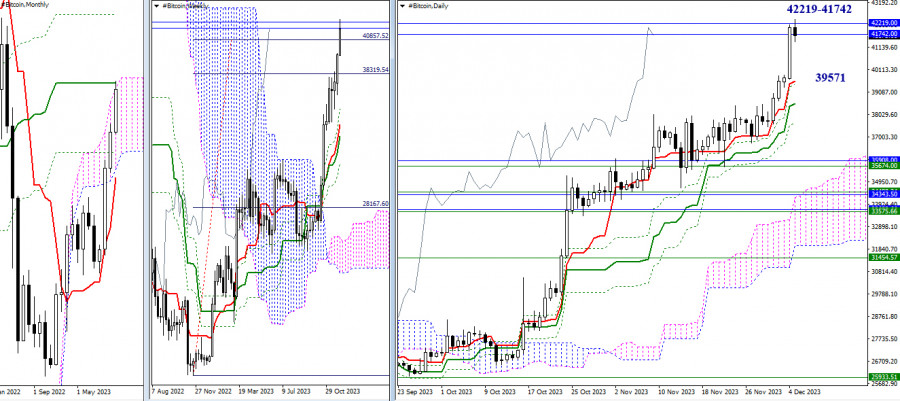
In November, Bitcoin slowly but steadily continued to rise. At the beginning of December, the upward momentum of market participants intensified. As a result, they not only achieved the weekly target of 40,857.52 (100% retracement) but also reached the confluence of monthly resistances at 42,219 – 41,742 (medium-term trend + upper boundary of the cloud). Breaking through these resistances and securely establishing in the bullish zone relative to the monthly cloud will significantly expand the upside potential for market participants. The next upward target will be the final level of the death cross of the monthly Ichimoku cloud (48,530), and in addition, a breakout target above the monthly cloud will be formed.

Failure to overcome these crucial and strong resistances may lead to the formation of a rebound and the initiation of a corrective decline. The daily timeframe will be the first to respond to this, with correction targets being the supports of the golden cross of the daily Ichimoku cloud, currently located at 39,571 (Tenkan) and 38,548 (Kijun). Next, for the development of a downward correction, the supports of the weekly golden cross will be considered, the nearest of which are currently at 35,674 and 34,472, with reinforcement from monthly support levels at 35,908 and 34,371.

This image is no longer relevant

H4 – H1

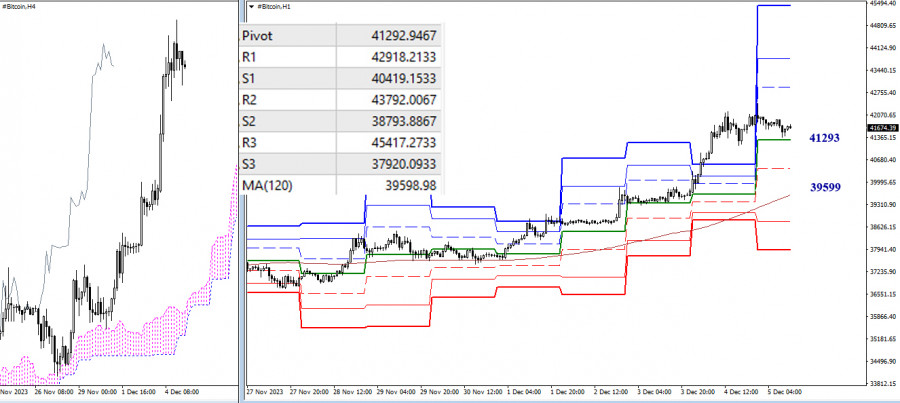
Bulls now have the main advantage on the lower timeframes. However, the pair has been in a corrective zone for a long time. Exiting the zone (42,424) will refocus the market's attention on bullish targets. Intraday bullish targets are represented by the resistances of classic pivot points (42,918 – 43,792 – 45,417). If the corrective decline receives a new impetus, the first tasks for bearish market participants will be testing and breaking through key levels at 41,293 (central pivot point of the day) and 39,599 (weekly long-term trend), with additional support from S1 (40,419). If consolidation below and a reversal of the movement occur, it will allow bearish market participants to change the current balance of power and strengthen their positions, also creating new bearish prospects as a result.

***

The technical analysis of the situation uses:

Higher timeframes - Ichimoku Kinko Hyo (9.26.52) + Fibo Kijun levels

H1 - Pivot Points (classic) + Moving Average 120 (weekly long-term trend)

Evangelos Poulakis,
الخبير التحليلي لدى شركة إنستافوركس
© 2007-2025
Summary
Urgency
Analytic
Zhizhko Nadezhda
Start trade
كسب عائد من تغيرات أسعار العملات المشفرة مع إنستافوركس.
قم بتحميل منصة التداول ميتاتريدر 4 وافتح أول صفقة.
  • Grand Choice
    Contest by
    InstaForex
    InstaForex always strives to help you
    fulfill your biggest dreams.
    انضم إلى المسابقة

المقالات الموصى بها

توقعات الفوركس 15/07/2025: اليورو/الدولار الأمريكي، الجنيه الإسترليني/الدولار الأمريكي، الدولار الأمريكي/الين الياباني، النفط والبيتكوين

روابط مفيدة: مقالاتي الأخرى متوفرة في هذا القسم دورة InstaForex للمبتدئين التحليلات الشائعة افتح حساب تداول مهم: يجب على المبتدئين في تداول الفوركس أن يكونوا حذرين للغاية عند اتخاذ القرارات

Sebastian Seliga 12:58 2025-07-15 UTC+2

تحليل وتوقعات زوج الجنيه الإسترليني/الدولار الأمريكي

اليوم، يتماسك زوج الجنيه الإسترليني/الدولار الأمريكي ضمن مستوى 1.3430–1.3435، محافظًا على مستوى أعلى قليلاً من أدنى مستوى له خلال ثلاثة أسابيع والذي سُجل خلال الجلسة الآسيوية، بينما تنتظر الأسواق صدور

Irina Yanina 12:18 2025-07-15 UTC+2

التوقعات لليورو/الدولار الأمريكي في 15 يوليو 2025

في يوم الاثنين، تداول زوج اليورو/الدولار الأمريكي بشكل جانبي، وكانت نشاطات السوق بشكل عام منخفضة جداً. وبالتالي، على الرغم من الشعور السائد بالهبوط، فشل الدببة في دفع الزوج إلى الأسفل

Samir Klishi 11:46 2025-07-15 UTC+2

التوقعات لزوج الجنيه الإسترليني/الدولار الأمريكي في 15 يوليو 2025

على الرسم البياني الساعي، استمر زوج الجنيه الإسترليني/الدولار الأمريكي في الانخفاض يوم الاثنين، وبحلول نهاية اليوم وصل إلى منطقة الدعم 1.3425–1.3444. الارتداد من هذه المنطقة سيعمل لصالح الجنيه الإسترليني ويؤدي

Samir Klishi 11:30 2025-07-15 UTC+2

على الرغم من إمكانية حدوث تصحيح إلى مستوى الدعم الأقرب، لا يزال لزوج USD/CHF إمكانية العودة إلى التوجه الصعودي يوم الثلاثاء، 15 يوليو 2025.

USD/CHF - الثلاثاء، 15 يوليو 2025. تشير حالة "التقاطع الذهبي" بين المتوسط المتحرك الأسي (EMA) لـ 50 يوماً و200 يوماً إلى أن المشترين لا يزالون يسيطرون، على الرغم من وجود

Arief Makmur 07:31 2025-07-15 UTC+2

إذا تمسك اليورو/الدولار الأمريكي بمستوى المقاومة 1، فإن لديه إمكانية للضعف مرة أخرى يوم الثلاثاء، 15 يوليو 2025.

اليورو/الدولار الأمريكي - الثلاثاء، 15 يوليو 2025. على الرغم من أن مؤشر القوة النسبية (RSI) لفترة 14 يوماً عند 55.39 (محايد-صعودي)، إلا أن المتوسط المتحرك الأسي (EMA) لفترة 50 يوماً

Arief Makmur 07:31 2025-07-15 UTC+2

توقعات EUR/USD ليوم 15 يوليو 2025

على الرسم البياني اليومي، استقر السعر تحت مستوى 1.1692. يدخل مؤشر Marlin حاليًا في منطقة الاتجاه الهابط. الهدف عند 1.1535 مفتوح الآن. كسر هذا المستوى سيمهد الطريق لمزيد من الانخفاض

Laurie Bailey 05:12 2025-07-15 UTC+2

توقعات GBP/USD ليوم 15 يوليو 2025

بحلول نهاية يوم الاثنين، استقر الجنيه الإسترليني تحت خط مؤشر التوازن، مقتربًا من مستوى الدعم المستهدف عند 1.3369 بفارق 65 نقطة. بدأ خط الإشارة لمذبذب مارلين في التحول نحو الأعلى،

Laurie Bailey 05:12 2025-07-15 UTC+2

توقعات USD/JPY ليوم 15 يوليو 2025

بعد الارتداد من مستوى الدعم عند 146.11، وصل زوج USD/JPY إلى الخط العلوي لنمط الوتد على الرسم البياني اليومي ويستهدف الآن مستوى المقاومة 148.66 (أعلى مستوى في 12 مايو)

Laurie Bailey 05:12 2025-07-15 UTC+2

تحليل وتوقعات USD/JPY

يبقى زوج الدولار الأمريكي/الين الياباني في مرحلة تماسك بالقرب من أعلى مستوى له في ثلاثة أسابيع، مدعومًا بقوة الدولار الأمريكي وإشارات السوق المتباينة. يتلقى الدولار دعمًا من تهديد الرئيس الأمريكي

Irina Yanina 12:17 2025-07-14 UTC+2
لا تستطيع التحدث الآن؟
اطرح سؤالك في الدردشة.
Widget callback
 

Dear visitor,

Your IP address shows that you are currently located in the USA. If you are a resident of the United States, you are prohibited from using the services of InstaFintech Group including online trading, online transfers, deposit/withdrawal of funds, etc.

If you think you are seeing this message by mistake and your location is not the US, kindly proceed to the website. Otherwise, you must leave the website in order to comply with government restrictions.

Why does your IP address show your location as the USA?

  • - you are using a VPN provided by a hosting company based in the United States;
  • - your IP does not have proper WHOIS records;
  • - an error occurred in the WHOIS geolocation database.

Please confirm whether you are a US resident or not by clicking the relevant button below. If you choose the wrong option, being a US resident, you will not be able to open an account with InstaForex anyway.

We are sorry for any inconvenience caused by this message.