

signal strength 2 of 5

The Bullish Flag pattern has been formed on the chart AUDJPY M15 which signals that the upward trend will continue. Signals: а break of the peak at 90.88 may push the price higher, and the rise will be the projection of the pole.
The M5 and M15 time frames may have more false entry points.
- All
- Double Top
- Flag
- Head and Shoulders
- Pennant
- Rectangle
- Triangle
- Triple top
- All
- #AAPL
- #AMZN
- #Bitcoin
- #EBAY
- #FB
- #GOOG
- #INTC
- #KO
- #MA
- #MCD
- #MSFT
- #NTDOY
- #PEP
- #TSLA
- #TWTR
- AUDCAD
- AUDCHF
- AUDJPY
- AUDUSD
- EURCAD
- EURCHF
- EURGBP
- EURJPY
- EURNZD
- EURRUB
- EURUSD
- GBPAUD
- GBPCHF
- GBPJPY
- GBPUSD
- GOLD
- NZDCAD
- NZDCHF
- NZDJPY
- NZDUSD
- SILVER
- USDCAD
- USDCHF
- USDJPY
- USDRUB
- All
- M5
- M15
- M30
- H1
- D1
- All
- Buy
- Sale
- All
- 1
- 2
- 3
- 4
- 5

The Triple Bottom pattern has formed on the chart of EURUSD H1. Features of the pattern: The lower line of the pattern has coordinates 1.1439 with the upper limit 1.1439/1.1357
Open chart in a new window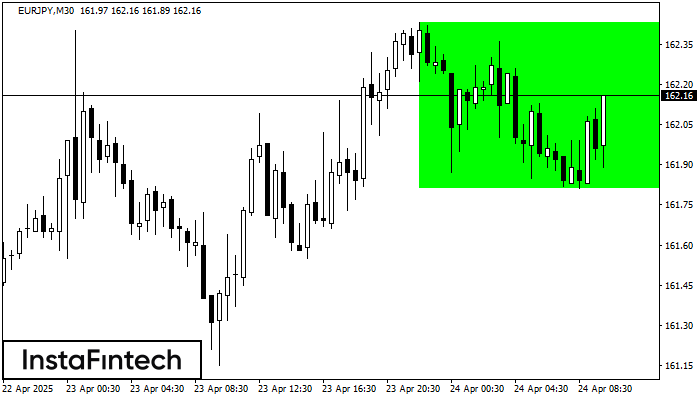
According to the chart of M30, EURJPY formed the Bullish Rectangle. The pattern indicates a trend continuation. The upper border is 162.43, the lower border is 161.81. The signal means
Open chart in a new window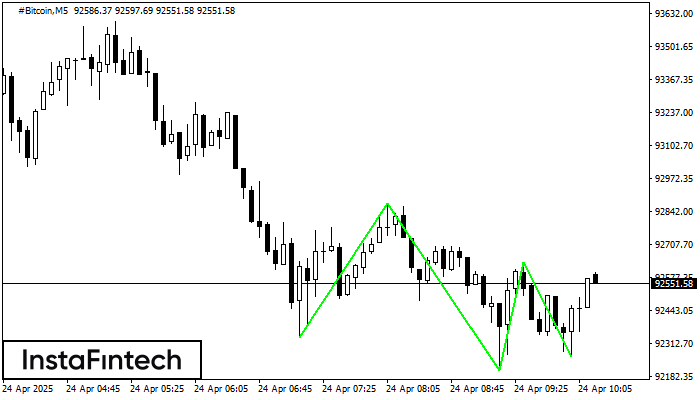
The Triple Bottom pattern has formed on the chart of #Bitcoin M5. Features of the pattern: The lower line of the pattern has coordinates 92871.00 with the upper limit 92871.00/92637.22
The M5 and M15 time frames may have more false entry points.
Open chart in a new window


