

signal strength 1 of 5
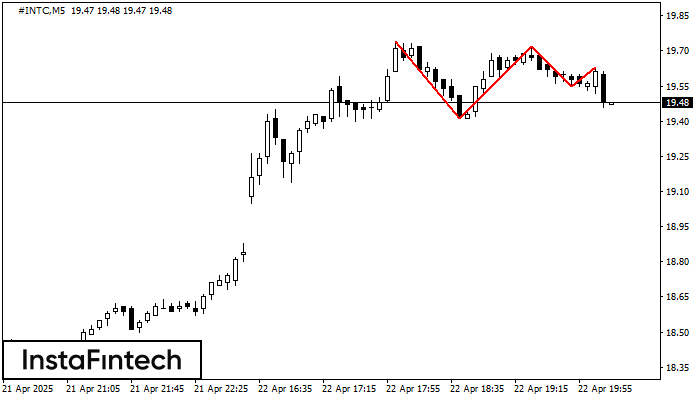
The Triple Top pattern has formed on the chart of the #INTC M5. Features of the pattern: borders have an ascending angle; the lower line of the pattern has the coordinates 19.41/19.55 with the upper limit 19.74/19.63; the projection of the width is 33 points. The formation of the Triple Top figure most likely indicates a change in the trend from upward to downward. This means that in the event of a breakdown of the support level of 19.41, the price is most likely to continue the downward movement.
The M5 and M15 time frames may have more false entry points.
- All
- Double Top
- Flag
- Head and Shoulders
- Pennant
- Rectangle
- Triangle
- Triple top
- All
- #AAPL
- #AMZN
- #Bitcoin
- #EBAY
- #FB
- #GOOG
- #INTC
- #KO
- #MA
- #MCD
- #MSFT
- #NTDOY
- #PEP
- #TSLA
- #TWTR
- AUDCAD
- AUDCHF
- AUDJPY
- AUDUSD
- EURCAD
- EURCHF
- EURGBP
- EURJPY
- EURNZD
- EURRUB
- EURUSD
- GBPAUD
- GBPCHF
- GBPJPY
- GBPUSD
- GOLD
- NZDCAD
- NZDCHF
- NZDJPY
- NZDUSD
- SILVER
- USDCAD
- USDCHF
- USDJPY
- USDRUB
- All
- M5
- M15
- M30
- H1
- D1
- All
- Buy
- Sale
- All
- 1
- 2
- 3
- 4
- 5
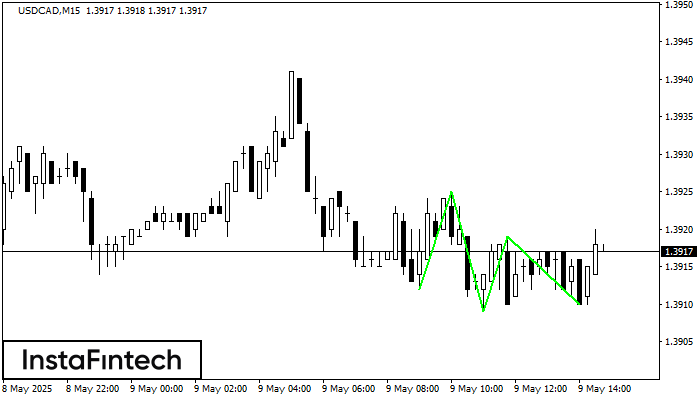
M15 চার্টে USDCAD-এর ট্রিপল বটম প্যাটার্নটি গঠিত হয়েছে। প্যাটার্নের বৈশিষ্ট্য: প্যাটার্নের নীচের লাইনে কোঅর্ডিনেট 1.3925 রয়েছে এবং এটির উপরের সীমা 1.3925/1.3919, প্রস্থের প্রজেকশন হল 13 পয়েন্ট। ট্রিপল বটম প্যাটার্নের
M5 এবং M15 টাইম ফ্রেমে আরও ভুল এন্ট্রি পয়েন্ট থাকতে পারে।
Open chart in a new window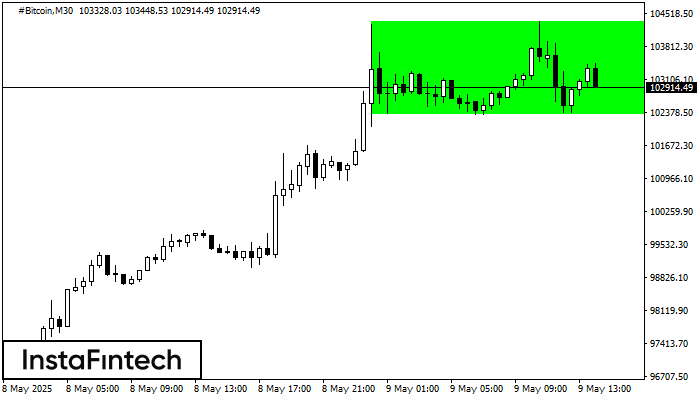
M30 চার্ট অনুসারে, #Bitcoin বুলিশ রেক্ট্যাঙ্গেল গঠন করেছে যা চলমান প্রবণতার ধারাবাহিকতার প্যাটার্ন। প্যাটার্নটি নিম্নলিখিত সীমানার মধ্যে রয়েছে: নীচের সীমানা 102332.80 – 102332.80 এবং উপরের সীমানা 104346.22 – 104346.22৷ উপরের
Open chart in a new window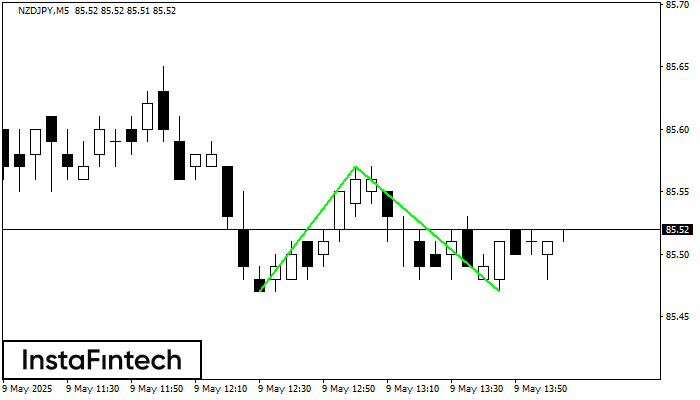
M5 চার্টে, NZDJPY-এর ডাবল বটম প্যাটার্নটি গঠিত হয়েছে। এই প্যাটার্নের গঠন এই সংকেত প্রদান করে যে মূল্য বিপরীতমুখী হয়ে নিম্নমুখী থেকে ঊর্ধ্বমুখী প্রবণতা প্রদর্শন করবে। এই প্যাটার্নের উপরের সীমানা 85.57
M5 এবং M15 টাইম ফ্রেমে আরও ভুল এন্ট্রি পয়েন্ট থাকতে পারে।
Open chart in a new window


