empty
10.04.2025 08:11 PM
GBP/USD: Trading Plan for the U.S. Session on April 10th (Review of Morning Trades)

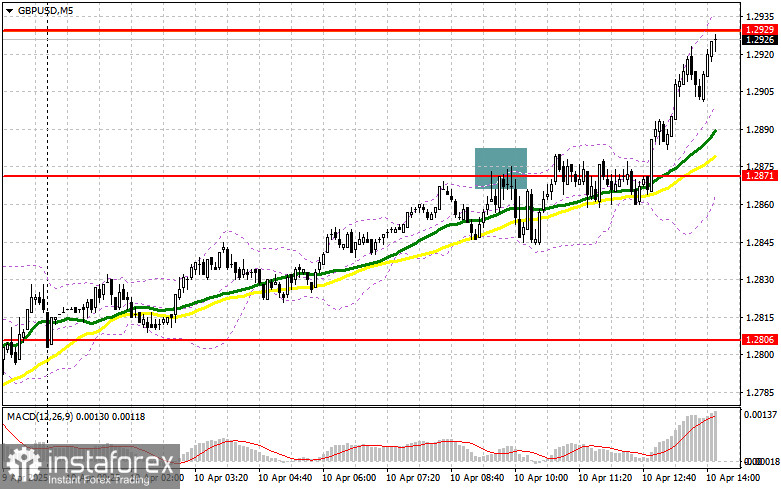
In my morning forecast, I highlighted the 1.2871 level and planned to make market entry decisions based on it. Let's look at the 5-minute chart and see what happened. A rise and a false breakout at that level led to an entry point for shorting the pound, resulting in a 25-point decline in the pair. The technical outlook has been revised for the second half of the day.

This image is no longer relevant

To open long positions on GBP/USD:

The pound continued to recover even without important fundamental statistics from the UK. Comments from Bank of England officials did not put significant pressure on the pound, as markets remained in euphoria over the lifting of U.S. trade tariffs. However, in the second half of the day, pressure on the pair may return, as important U.S. Consumer Price Index (CPI) data for March is expected, along with several speeches from Federal Reserve representatives. Special attention should be paid to remarks from FOMC member Michelle Bowman. A hawkish stance on interest rates could trigger a GBP/USD correction — which I plan to use.

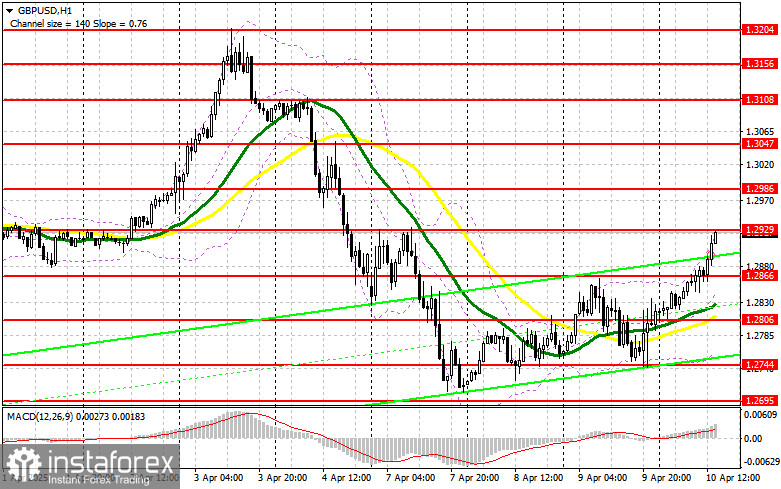
If the pair declines, I prefer to act around the 1.2866 support formed earlier today. A false breakout there would be a good entry point for long positions, targeting a recovery to the 1.2929 resistance level, which is currently being tested. A breakout and a downward retest of this range would lead to a new entry point for long positions, with the potential to revisit 1.2986 — a significant correction. The furthest target will be the 1.3047 level, where I plan to take profits. A test of this level would mark the end of the bearish market development.

If GBP/USD declines and there is no buyer activity near 1.2866, pressure on the pair will increase. In that case, only a false breakout around 1.2806 would be a valid condition for opening long positions. I plan to buy GBP/USD on a rebound from the 1.2744 support level, targeting an intraday correction of 30–35 points.

To open short positions on GBP/USD:

Sellers tried to make their presence known, but the positive news backdrop following the U.S. tariff removal did its job. If GBP/USD rises during the U.S. session following Fed comments and news of lower U.S. inflation, a false breakout around 1.2929 would provide a short entry point, targeting a drop to the new 1.2866 support level. A breakout and retest from below would trigger stop-loss orders, opening the way to 1.2806, where moving averages — currently supporting the bulls — are located. The furthest target will be the 1.2744 level, where I plan to take profits.

If demand for the pound persists this afternoon and bears do not act near 1.2929, it's best to postpone shorts until a test of the 1.2986 resistance. I'll open short positions there only on a false breakout. If there's no downward movement even there, I'll look for short entries around 1.3047 — but only with the aim of a 30–35 point intraday correction.

This image is no longer relevant

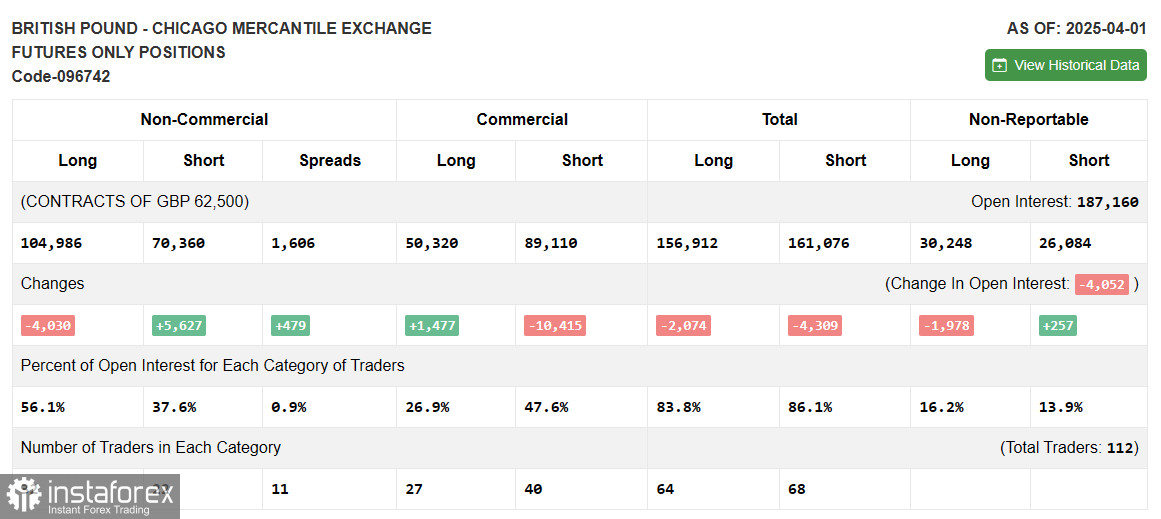
COT (Commitment of Traders) Report – April 1:

There was a slight increase in short positions and a decrease in long positions. It's important to note that this report does not reflect the recent U.S. trade tariffs introduced against major economic partners — including the UK — nor the latest U.S. March employment data. Therefore, a deep analysis of these figures is not advisable, as they no longer reflect the current situation. The latest COT report showed long non-commercial positions dropped by 4,030 to 104,986, while short non-commercial positions increased by 5,627 to 64,733. As a result, the gap between long and short positions widened by 479.

This image is no longer relevant

Indicator signals:

Moving Averages Trading is taking place above the 30- and 50-period moving averages, indicating that the pair's correction is continuing.

Note: The periods and prices of moving averages referenced are based on the author's hourly chart (H1) and differ from classic daily moving averages on the D1 chart.

Bollinger Bands In case of a decline, the lower boundary of the indicator around 1.2750 will serve as support.

Indicator descriptions:

  • Moving Average – Determines the current trend by smoothing volatility and noise.
    • Period 50: Yellow on the chart
    • Period 30: Green on the chart
  • MACD (Moving Average Convergence/Divergence)
    • Fast EMA: Period 12
    • Slow EMA: Period 26
    • Signal Line (SMA): Period 9
  • Bollinger Bands – Period 20
  • Non-commercial traders – Speculators such as individual traders, hedge funds, and large institutions that use the futures market for speculative purposes.
  • Non-commercial long positions – Total open long positions held by non-commercial traders.
  • Non-commercial short positions – Total open short positions held by non-commercial traders.
  • Net non-commercial position – The difference between non-commercial long and short positions.
Miroslaw Bawulski,
Analytical expert of InstaForex
© 2007-2025
GBPUSD
Great Britain Pound vs US Dollar
Summary
Buy
Urgency
1 day
Analytic
Maxim Magdalinin
Start trade
Earn on cryptocurrency rate changes with InstaForex
Download MetaTrader 4 and open your first trade
  • Grand Choice
    Contest by
    InstaForex
    InstaForex always strives to help you
    fulfill your biggest dreams.
    JOIN CONTEST

Recommended Stories

GBP/USD: Trading Plan for the U.S. Session on July 7th (Review of Morning Trades)

In my morning forecast, I highlighted the 1.3602 level and planned to use it to determine entry points into the market. Let's look at the 5-minute chart and analyze what

Miroslaw Bawulski 13:21 2025-07-07 UTC+2

EUR/USD: Trading Plan for the U.S. Session on July 7th (Review of the Morning Trades)

In my morning forecast, I highlighted the 1.1749 level and planned to base market entry decisions around it. Let's look at the 5-minute chart and break down what happened

Miroslaw Bawulski 13:20 2025-07-07 UTC+2

How to Trade the GBP/USD Currency Pair on July 7th? Simple Tips and Trade Review for Beginners

On Friday, the GBP/USD pair showed total flat movement and low volatility. As with the EUR/USD pair, there was no news that day, and no macroeconomic publications were released either

Paolo Greco 07:48 2025-07-07 UTC+2

How to Trade the EUR/USD Currency Pair on July 7th: Simple Tips and Trade Analysis for Beginners

Friday Trade Analysis: EUR/USD 1H Chart The EUR/USD pair stayed flat all day Friday, with volatility totaling 36 points, clearly indicating a lack of trading activity. This is not surprising

Paolo Greco 07:32 2025-07-07 UTC+2

GBP/USD Trading Recommendations and Trade Analysis for July 7th

The GBP/USD currency pair traded with low volatility and primarily moved sideways. As mentioned earlier, last week was particularly interesting in how the market interpreted various events and publications

Paolo Greco 07:11 2025-07-07 UTC+2

EUR/USD Trading Recommendations and Trade Analysis for July 7th

The EUR/USD currency pair did not exhibit any notable movements on Friday—or any movements at all. Friday was Independence Day in the United States, effectively making it a non-trading

Paolo Greco 07:03 2025-07-07 UTC+2

GBP/USD: Trading Plan for the U.S. Session on July 4th (Review of Morning Trades)

In my morning forecast, I highlighted the 1.3672 level as a key decision point for entering the market. Let's look at the 5-minute chart and analyze what happened. A rise

Miroslaw Bawulski 18:20 2025-07-04 UTC+2

EUR/USD: Trading Plan for the U.S. Session on July 4th (Review of Morning Trades)

In my morning forecast, I highlighted the 1.1787 level as a key point for making trading decisions. Let's look at the 5-minute chart to analyze what happened. A rise

Miroslaw Bawulski 18:16 2025-07-04 UTC+2

How to Trade the GBP/USD Pair on July 4? Simple Tips and Trade Analysis for Beginners

Analysis of Thursday's Trades 1H Chart of GBP/USD On Thursday, the GBP/USD pair once again plummeted, but this time the drop in the British currency lasted only five minutes

Paolo Greco 07:16 2025-07-04 UTC+2

How to Trade the EUR/USD Pair on July 4? Simple Tips and Trade Analysis for Beginners

Analysis of Thursday's Trades 1H Chart of EUR/USD The EUR/USD currency pair traded throughout Thursday, both before and after the publication of the U.S. Nonfarm Payrolls and unemployment data

Paolo Greco 06:34 2025-07-04 UTC+2
Can't speak right now?
Ask your question in the chat.
Widget callback
 

Dear visitor,

Your IP address shows that you are currently located in the USA. If you are a resident of the United States, you are prohibited from using the services of InstaFintech Group including online trading, online transfers, deposit/withdrawal of funds, etc.

If you think you are seeing this message by mistake and your location is not the US, kindly proceed to the website. Otherwise, you must leave the website in order to comply with government restrictions.

Why does your IP address show your location as the USA?

  • - you are using a VPN provided by a hosting company based in the United States;
  • - your IP does not have proper WHOIS records;
  • - an error occurred in the WHOIS geolocation database.

Please confirm whether you are a US resident or not by clicking the relevant button below. If you choose the wrong option, being a US resident, you will not be able to open an account with InstaForex anyway.

We are sorry for any inconvenience caused by this message.