signal strength 2 of 5

The Bullish Flag pattern has been formed on the chart AUDJPY M15 which signals that the upward trend will continue. Signals: а break of the peak at 90.88 may push the price higher, and the rise will be the projection of the pole.
The M5 and M15 time frames may have more false entry points.
See Also
- All
- Double Top
- Flag
- Head and Shoulders
- Pennant
- Rectangle
- Triangle
- Triple top
- All
- #AAPL
- #AMZN
- #Bitcoin
- #EBAY
- #FB
- #GOOG
- #INTC
- #KO
- #MA
- #MCD
- #MSFT
- #NTDOY
- #PEP
- #TSLA
- #TWTR
- AUDCAD
- AUDCHF
- AUDJPY
- AUDUSD
- EURCAD
- EURCHF
- EURGBP
- EURJPY
- EURNZD
- EURRUB
- EURUSD
- GBPAUD
- GBPCHF
- GBPJPY
- GBPUSD
- GOLD
- NZDCAD
- NZDCHF
- NZDJPY
- NZDUSD
- SILVER
- USDCAD
- USDCHF
- USDJPY
- USDRUB
- All
- M5
- M15
- M30
- H1
- D1
- All
- Buy
- Sale
- All
- 1
- 2
- 3
- 4
- 5
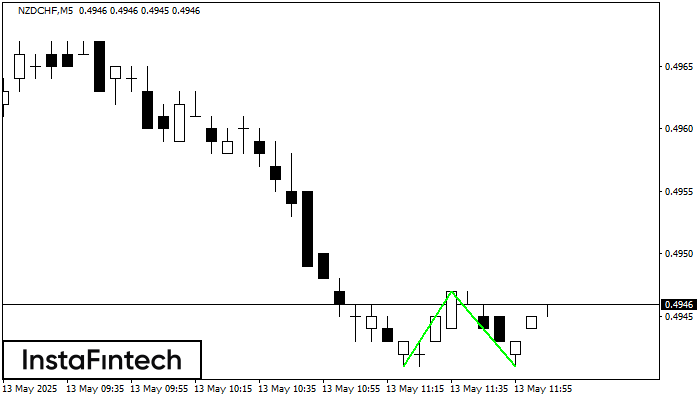
The Double Bottom pattern has been formed on NZDCHF M5; the upper boundary is 0.4947; the lower boundary is 0.4941. The width of the pattern is 6 points. In case
The M5 and M15 time frames may have more false entry points.
Open chart in a new window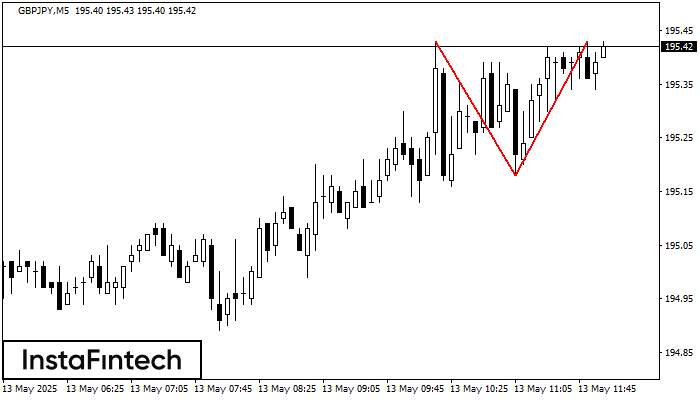
On the chart of GBPJPY M5 the Double Top reversal pattern has been formed. Characteristics: the upper boundary 195.43; the lower boundary 195.18; the width of the pattern 25 points
The M5 and M15 time frames may have more false entry points.
Open chart in a new window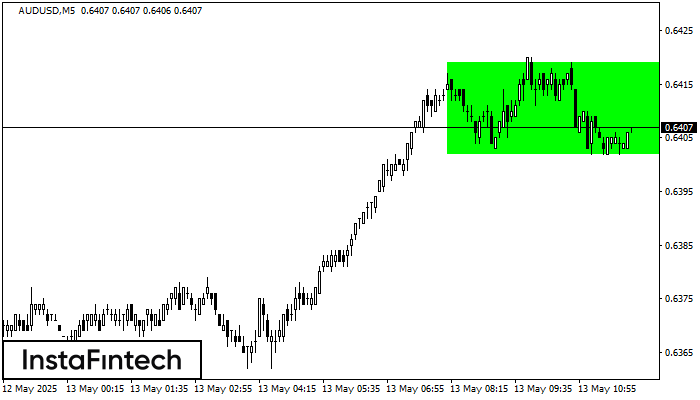
According to the chart of M5, AUDUSD formed the Bullish Rectangle. This type of a pattern indicates a trend continuation. It consists of two levels: resistance 0.6419 and support 0.6402
The M5 and M15 time frames may have more false entry points.
Open chart in a new window