empty
23.12.2024 07:06 AM
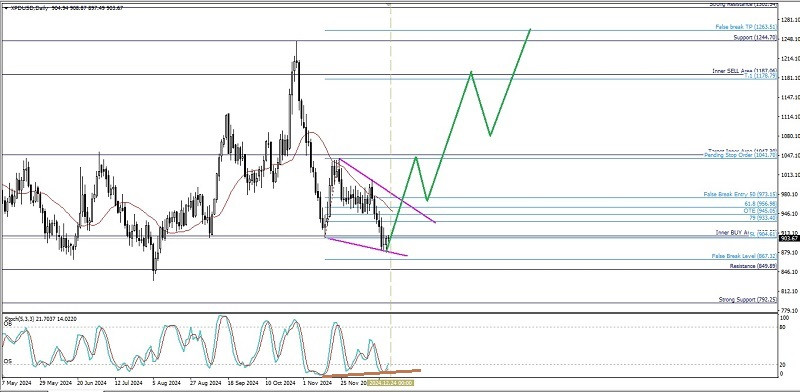
Technical Analysis of Daily Price Movement of Palladium vs USD Commodity Asset, Monday December 23, 2024.

This image is no longer relevant

From what we can see on the daily chart of the Palladium commodity asset against the USD, it appears to be under seller pressure, this is confirmed by its price movement which is moving below the WMA (30 Shift 2) which has a downward slope, but with the appearance of the Failing Wedge pattern and the deviation between the price movement of #XPD/USD, then in the next few days as long as there is no further decline that breaks through and closes below the 867.32 level, then #XPD/USD has the potential to turn around and strengthen upwards where the 1041.70 level will be tested to be broken and close above that level if successful, then #XPD/USD will continue to strengthen to the 1178.79 and 1263.51 levels as the next targets if momentum and volatility support.

(Disclaimer)

Select timeframe
5
min
15
min
30
min
1
hour
4
hours
1
day
1
week
Earn on cryptocurrency rate changes with InstaForex
Download MetaTrader 4 and open your first trade
  • Grand Choice
    Contest by
    InstaForex
    InstaForex always strives to help you
    fulfill your biggest dreams.
    JOIN CONTEST

Recommended Stories

EUR/USD: January 13th. The Euro's Collapse Continues

On Friday, the EUR/USD pair continued its decline, breaking below the 127.2% Fibonacci corrective level at 1.0255. On Monday, the downward movement persisted overnight, heading toward the next Fibonacci level

Samir Klishi 11:33 2025-01-13 UTC+2

GBP/USD: January 13. The Pound Remains in Free Fall

On the hourly chart, the GBP/USD pair made a vague rebound from the 261.8% Fibonacci corrective level at 1.2303 on Friday and continues its decline. Today, the pair has already

Samir Klishi 11:23 2025-01-13 UTC+2

Video analysis for January 13, 2025

Potential for the further drop on BTCUSD

Petar Jacimovic 10:55 2025-01-13 UTC+2

Technical Analysis of Daily Price Movement of CAD/JPY Cross Currency Pairs, Monday January 13, 2025.

With the appearance of deviations between the CAD/JPY price movement which forms a Higher-High with the Stochastic Oscillator indicator which actually forms a Lower-High and its price movement which

Arief Makmur 06:16 2025-01-13 UTC+2

Technical Analysis of Weekly Price Movement of USD/CHF Main Currency Pairs, Monday January 13, 2025.

If we look at the weekly chart of the USD/CHF currency pair, a Bearish BAT Harmonic pattern appears. This is also confirmed by the deviation between the USD/CHF price movement

Arief Makmur 06:16 2025-01-13 UTC+2

Gold - Technical Analysis of the Situation

Last year produced strong results for gold, consistently recording new all-time highs. However, towards the end of the year, bearish players were able to push gold into a two-month corrective

Evangelos Poulakis 04:17 2025-01-13 UTC+2

Forecast for EUR/USD on January 13, 2025

As anticipated, U.S. employment data exceeded expectations, leading to a 0.44% strengthening of the dollar index, while the euro declined by 52 pips. The price has broken through the intermediate

Laurie Bailey 03:43 2025-01-13 UTC+2

Forecast for GBP/USD on January 13, 2025

On Friday, following strong employment data from the U.S., the pound sterling reached a significant support level at 1.2186 and has paused its movement this morning. The Marlin oscillator's signal

Laurie Bailey 03:42 2025-01-13 UTC+2

Forecast for AUD/USD on January 13, 2025

On the daily chart, the Australian dollar continues its decline within a descending price channel, trading below both indicator lines, which themselves are sloping downward. However, the Marlin oscillator

Laurie Bailey 03:42 2025-01-13 UTC+2

USD/JPY and EUR/JPY – Technical Analysis Overview

Last year, despite monthly fluctuations that included rises, declines, and recoveries, the market closed with an overall optimistic bullish candlestick, where the upper shadow was slightly longer than the lower

Evangelos Poulakis 23:34 2025-01-12 UTC+2
Can't speak right now?
Ask your question in the chat.
Widget callback
 

Dear visitor,

Your IP address shows that you are currently located in the USA. If you are a resident of the United States, you are prohibited from using the services of InstaFintech Group including online trading, online transfers, deposit/withdrawal of funds, etc.

If you think you are seeing this message by mistake and your location is not the US, kindly proceed to the website. Otherwise, you must leave the website in order to comply with government restrictions.

Why does your IP address show your location as the USA?

  • - you are using a VPN provided by a hosting company based in the United States;
  • - your IP does not have proper WHOIS records;
  • - an error occurred in the WHOIS geolocation database.

Please confirm whether you are a US resident or not by clicking the relevant button below. If you choose the wrong option, being a US resident, you will not be able to open an account with InstaForex anyway.

We are sorry for any inconvenience caused by this message.