empty
06.11.2023 06:29 AM
BITCOIN: Technical analysis of the situation

Bitcoin

This image is no longer relevant

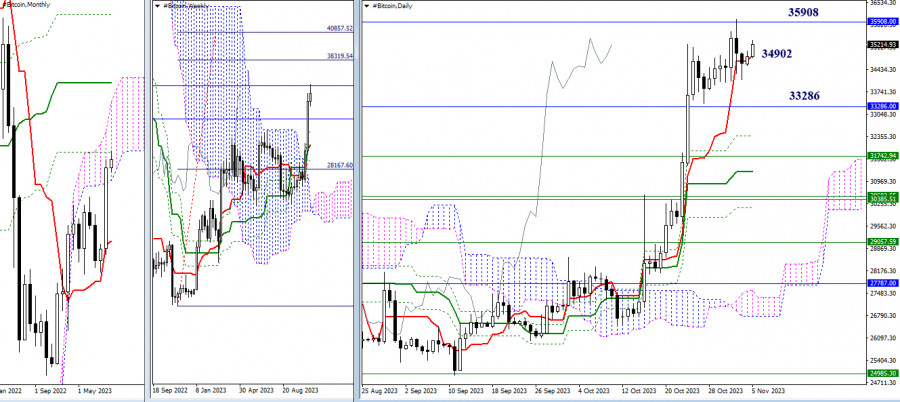
Higher timeframes

October provided bulls with moments of optimism, pushing the market away from the support of the monthly short-term trend towards the next resistance of the monthly death cross (35,908). Meanwhile, Bitcoin managed to close October within the monthly cloud (33,286), making the upper boundary of the Ichimoku cloud (40,490) the next upward target on this timeframe.

The result of October's activity was also the formation of an upward target for breaking the weekly cloud (38,320 - 40,858). These target levels (38,320 - 40,490 - 40,858) have been planned by the bullish players for November following the optimism and activity of October. This will only be possible if the bulls maintain and continue the October sentiment.

If priorities change and the bears return to the market. In that case, their focus will first be on exiting the monthly cloud (33,286) and then testing and liquidating the existing golden crosses of Ichimoku on the weekly and daily timeframes. The nearest supports from the golden crosses of Ichimoku at the moment can be noted at 32,380 - 31,743 - 31,261.

This image is no longer relevant

H4 - H1

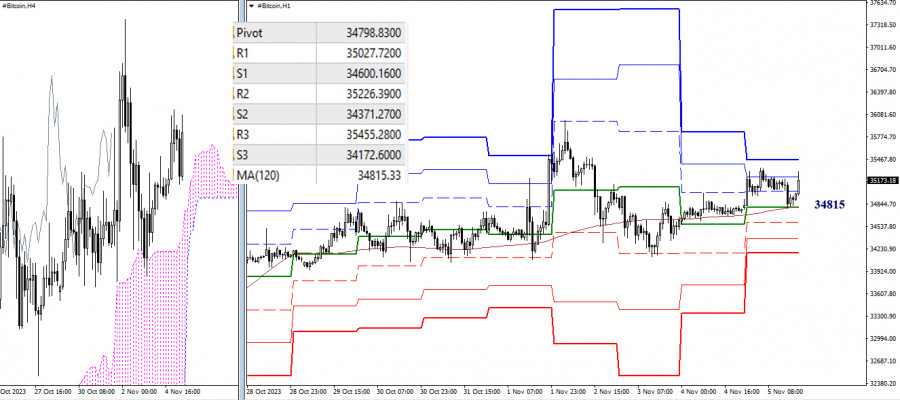
As of writing, the main advantage on the lower timeframes remains with the bullish players. However, the balance of power is very fragile because the weekly long-term trend (34,815) has been acting as support for a long time, responsible for the distribution and balance of power. Bitcoin can lose this support at any moment, after which the market's attention will shift within the day to the supports of the classic pivot points. The primary priority in this case will be the strengthening of bearish sentiments.

Note that the loss of the key level of the lower timeframes—34,815 (weekly long-term trend), is currently associated with losing the center of attraction of the daily timeframe—34,902 (short-term trend). A secure consolidation below 34,902 - 34,815 opens up new prospects for bears, both within the day and on the higher timeframes.

***

The technical analysis of the situation uses:

Higher timeframes - Ichimoku Kinko Hyo (9.26.52) + Fibo Kijun levels

H1 - Pivot Points (classic) + Moving Average 120 (weekly long-term trend)

Evangelos Poulakis,
Analytical expert of InstaForex
© 2007-2025
Select timeframe
5
min
15
min
30
min
1
hour
4
hours
1
day
1
week
Earn on cryptocurrency rate changes with InstaForex
Download MetaTrader 4 and open your first trade
  • Grand Choice
    Contest by
    InstaForex
    InstaForex always strives to help you
    fulfill your biggest dreams.
    JOIN CONTEST

Recommended Stories

Technical Analysis of Intraday Price Movement of AUD/JPY Cross Currency Pairs, Wednesday, April 23, 2025.

With the appearance of Divergence between the price movement of the AUD/JPY cross currency pair with the Stochastic Oscillator indicator and the price movement of AUD/JPY which is above

Arief Makmur 06:37 2025-04-23 UTC+2

Technical Analysis of Intraday Price Movement of Gold Commodity Instrument, Wednesday, April 23, 2025.

If we look at the 4-hour chart, the Gold commodity instrument appears to still be moving in a Bullish bias, but with the appearance of Divergence between the Gold price

Arief Makmur 06:37 2025-04-23 UTC+2

Forex forecast 22/04/2025: EUR/USD, GBP/USD, USD/JPY and Bitcoin

Useful links: My other articles are available in this section InstaForex course for beginners Popular Analytics Open trading account Important: The begginers in forex trading need to be very careful

Sebastian Seliga 10:08 2025-04-22 UTC+2

Technical Analysis of Intraday Price Movement of GBP/CHF Cross Currency Pairs, Tuesday April 22, 2025.

If we look at the 4-hour chart of the GBP/CHF cross currency pair, there are several interesting facts. First, the appearance of a Triangle pattern followed by the movement

Arief Makmur 06:58 2025-04-22 UTC+2

Technical Analysis of Intraday Price Movement of AUD/CAD Cross Currency Pairs, Tuesday April 22, 2025.

With the price movement of the AUD/CAD cross currency pair moving above the WMA (21) which has an upward slopes and the appearance of Convergence between the price movement

Arief Makmur 06:58 2025-04-22 UTC+2

Trading Signals for GOLD (XAU/USD) for April 21-25, 2025: sell below $3,422 (overbought - 8/8 Murray)

The eagle indicator has reached overbought levels. However, the metal could still reach the high around 8/8 Murray, which represents a strong barrier for gold. Below this area, we could

Dimitrios Zappas 17:23 2025-04-21 UTC+2

Technical Analysis of Intraday Price Movement EUR/GBP Cross Currency Pairs, Monday April 21, 2025

From what is seen on the 4-hour chart, the EUR/GBP cross currency pair appears to be moving above the EMA (100), which indicates that Buyers dominate the currency pair

Arief Makmur 04:19 2025-04-21 UTC+2

Technical Analysis of Intraday Price Movement USD/JPY Main Currency Pairs, Monday April 21, 2025.

With the appearance of Convergence between the price movement of the main currency pair USD/JPY with the Stochastic Oscillator indicator and the position of the EMA (100) which is above

Arief Makmur 04:19 2025-04-21 UTC+2

Forex forecast 18/04/2025: EUR/USD, GBP/USD, Gold and Bitcoin

Useful links: My other articles are available in this section InstaForex course for beginners Popular Analytics Open trading account Important: The begginers in forex trading need to be very careful

Sebastian Seliga 10:18 2025-04-18 UTC+2

Gold: Ongoing Uncertainty Continues to Support Gold Prices

Gold prices continue to receive support amid the fog of uncertainty surrounding the future course of the tariff wars initiated by Donald Trump. The price of gold has been climbing

Pati Gani 11:49 2025-04-17 UTC+2
Can't speak right now?
Ask your question in the chat.
Widget callback
 

Dear visitor,

Your IP address shows that you are currently located in the USA. If you are a resident of the United States, you are prohibited from using the services of InstaFintech Group including online trading, online transfers, deposit/withdrawal of funds, etc.

If you think you are seeing this message by mistake and your location is not the US, kindly proceed to the website. Otherwise, you must leave the website in order to comply with government restrictions.

Why does your IP address show your location as the USA?

  • - you are using a VPN provided by a hosting company based in the United States;
  • - your IP does not have proper WHOIS records;
  • - an error occurred in the WHOIS geolocation database.

Please confirm whether you are a US resident or not by clicking the relevant button below. If you choose the wrong option, being a US resident, you will not be able to open an account with InstaForex anyway.

We are sorry for any inconvenience caused by this message.