signal strength 4 of 5

According to the chart of H1, EURNZD formed the Bullish Symmetrical Triangle pattern. Description: This is the pattern of a trend continuation. 2.0005 and 1.9118 are the coordinates of the upper and lower borders respectively. The pattern width is measured on the chart at 887 pips. Outlook: If the upper border 2.0005 is broken, the price is likely to continue its move by 1.9525.
- All
- Double Top
- Flag
- Head and Shoulders
- Pennant
- Rectangle
- Triangle
- Triple top
- All
- #AAPL
- #AMZN
- #Bitcoin
- #EBAY
- #FB
- #GOOG
- #INTC
- #KO
- #MA
- #MCD
- #MSFT
- #NTDOY
- #PEP
- #TSLA
- #TWTR
- AUDCAD
- AUDCHF
- AUDJPY
- AUDUSD
- EURCAD
- EURCHF
- EURGBP
- EURJPY
- EURNZD
- EURRUB
- EURUSD
- GBPAUD
- GBPCHF
- GBPJPY
- GBPUSD
- GOLD
- NZDCAD
- NZDCHF
- NZDJPY
- NZDUSD
- SILVER
- USDCAD
- USDCHF
- USDJPY
- USDRUB
- All
- M5
- M15
- M30
- H1
- D1
- All
- Buy
- Sale
- All
- 1
- 2
- 3
- 4
- 5
was formed on 29.05 at 15:00:17 (UTC+0)
signal strength 2 of 5
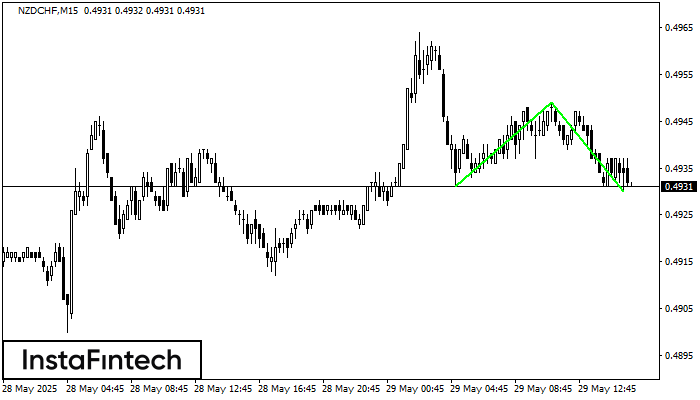
รูปแบบ รูปแบบกราฟจุดสองยอดขาลง (Double Bottom) ถูกสร้างขึ้นมาใน NZDCHF M15; ขอบเขตด้านบนอยู่ที่ 0.4949;ขอบเขตด้านล่าง คือ 0.4930 ความกว้างของรูปแบบนี้คือ 18 จุด กรณีที่มีการเคลื่อนตัวทะลุผ่านขอบเขตด้านบน
ขอบเตระยะเวลาใน M5 และ M15 อาจจะมีตำแหน่งการเข้าใช้งานที่ผิดพลาดมากยิ่งขึ้น
Open chart in a new windowwas formed on 29.05 at 14:04:55 (UTC+0)
signal strength 2 of 5
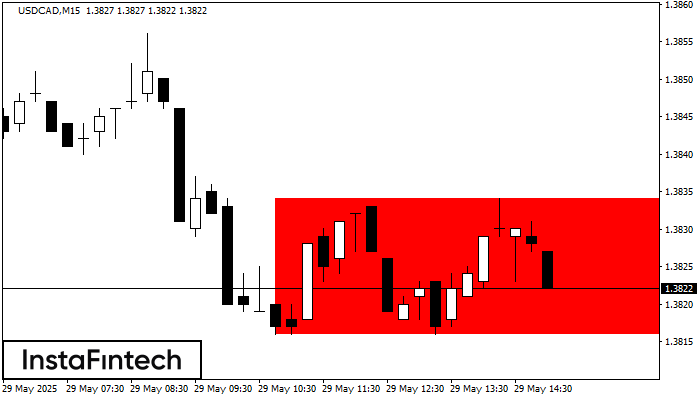
อ้างอิงจากชาร์ตของ M15, USDCAD ที่ได้สร้างรูปแบบ รูปแบบกราฟสี่เหลี่ยมผืนผ้าขาลง (Bearish Rectangle) ออกมา รูปแบบนี้แสดงถึง ความต่อเนื่องในแนวโน้ม ขอบเขตด้านบนคือ 1.3834 ส่วนขอบเขตด้านล่างคือ 1.3816 สัญญาณนี้แสดงถึง
ขอบเตระยะเวลาใน M5 และ M15 อาจจะมีตำแหน่งการเข้าใช้งานที่ผิดพลาดมากยิ่งขึ้น
Open chart in a new windowwas formed on 29.05 at 13:36:16 (UTC+0)
signal strength 1 of 5
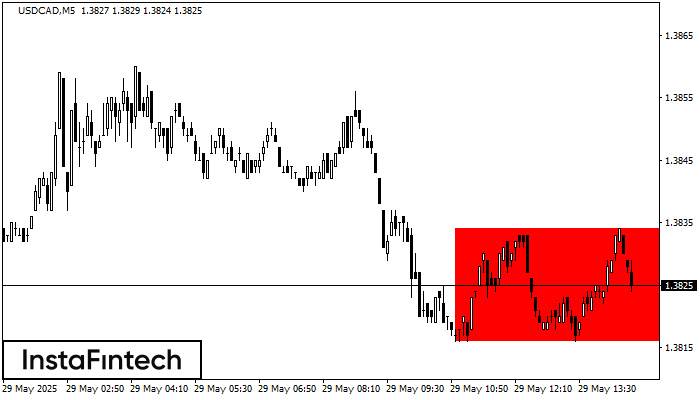
อ้างอิงจากชาร์ตของ M5, USDCAD ที่ได้สร้างรูปแบบ รูปแบบกราฟสี่เหลี่ยมผืนผ้าขาลง (Bearish Rectangle) ออกมา ซึ่งเป็นรูปแบบของ ความต่อเนื่องในแนวโน้ม รูปแบบนี้จะอยู่ภายในขอบเขตดังต่อไปนี้: ขอบเขตด้านล่าง 1.3816 – 1.3816
ขอบเตระยะเวลาใน M5 และ M15 อาจจะมีตำแหน่งการเข้าใช้งานที่ผิดพลาดมากยิ่งขึ้น
Open chart in a new window