empty
25.10.2021 01:00 PM
Technical analysis recommendations of EUR/USD and GBP/USD on October 25

EUR/USD

This image is no longer relevant

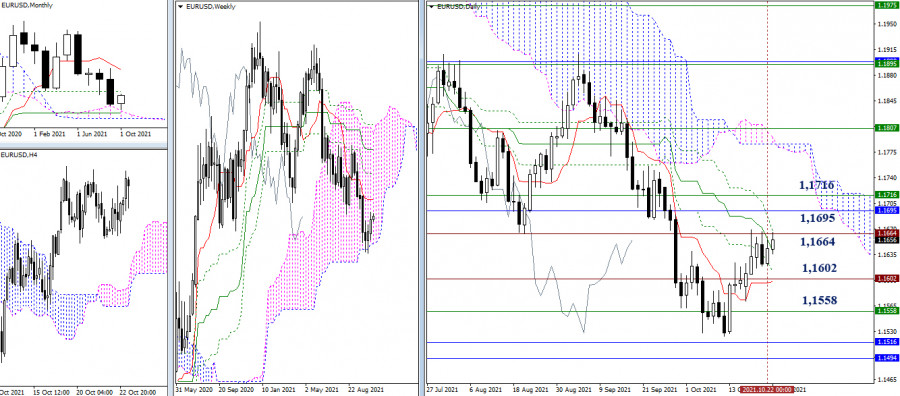
The slowdown below the historical resistance of 1.1664 remains. The final level of the Ichimoku daily dead cross (1.1667) has fallen into this area today. As a result, the breakdown of resistance will eliminate the bearish cross and help the bulls to strengthen their positions. The next upward targets are still at 1.1695 (monthly Fibo Kijun) and 1.1716 (weekly Tenkan). But in the case of bearish activity, the nearest support level of 1.1602 (historical level + daily levels) will be considered. The next interests can be directed to interacting with the level of 1.1558 (lower border of the weekly cloud) and 1.1516 - 1.1494 (monthly levels).

This image is no longer relevant

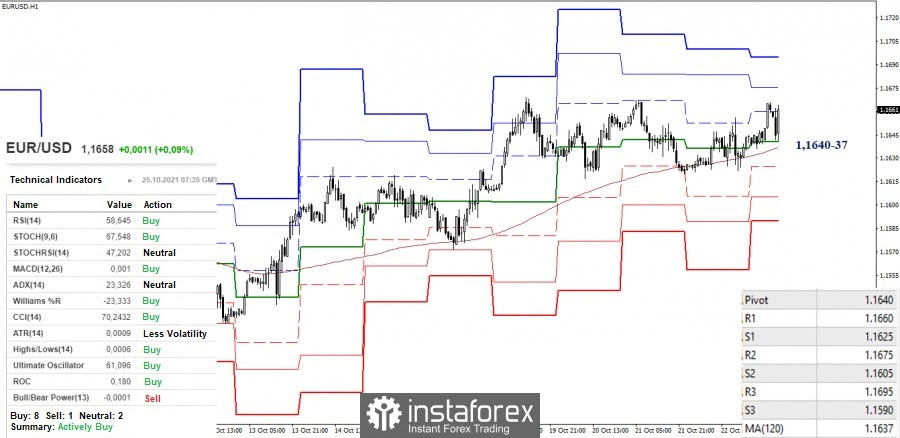
The pair continues to remain in the zone of the downward correction in the smaller timeframes. For a long time, the key support levels are being tested. They are joining forces in the area of 1.1640-37 today. A breakdown, consolidation below, and a reversal of moving averages will change the current balance of power in favor of the bears. The support for the classic pivot levels 1.1625 - 1.1605 - 1.1590 will serve as the intraday downward pivot points.

As for the bulls, the main task is to restore the upward trend (1.1669). The next upward pivot points can be 1.1675 (R2) and 1.1695 (R3), these resistances are being strengthened from the higher timeframes.

GBP/USD

This image is no longer relevant

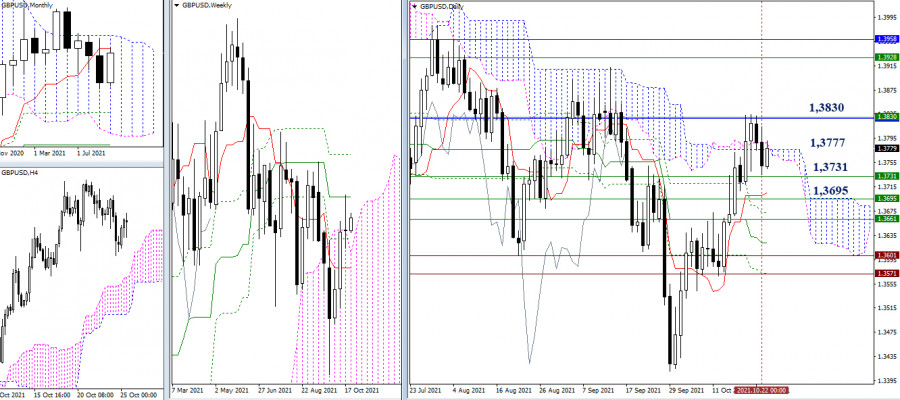
The bulls could not hold their positions below the encountered resistance level of 1.3830 (monthly short-term trend + weekly medium-term trend) during last week's closing. Currently, the attraction zone continues to provide a daily cloud (1.3777). The nearest support levels are set sequentially with some distance from each other – 1.3731 - 1.3695 - 1.3661 (daily and weekly levels).

This image is no longer relevant

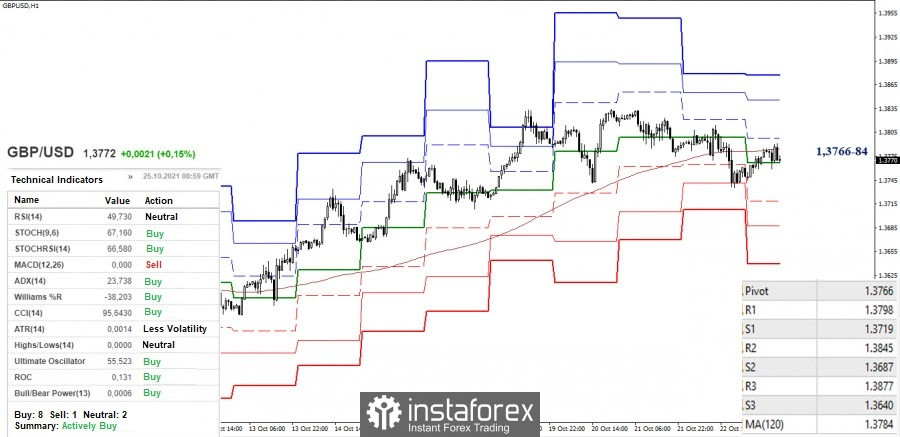
There is a struggle to reach the key levels in the smaller timeframes, which are uniting in the area of 1.3766-84 (central pivot level + weekly long-term trend). The continuation of the decline after the update of the low (1.3735) will open the way to the supports of the classic pivot levels (1.3719 - 1.3687 - 1.3640). On the contrary, a consolidation above the range of 1.3766-84 will set the task to recover the upward trend (1.3834). The resistances of the classic pivot levels 1.3845 and 1.3877 can be the additional upward pivot points within the day.

***

Ichimoku Kinko Hyo (9.26.52) and Kijun-sen levels in the higher time frames, as well as classic Pivot Points and Moving Average (120) on the H1 chart, are used in the technical analysis of the trading instruments.

Pilih carta masa
5
min
15
min
30
min
1
jam
4
jam
1
hari
1
minggu
Jana pendapatan melalui perubahan kadar mata wang kripto dengan InstaForex.
Muat turun MetaTrader 4 dan buka dagangan pertama anda.
  • Grand Choice
    Contest by
    InstaForex
    InstaForex always strives to help you
    fulfill your biggest dreams.
    SERTAI PERADUAN

Artikel yang dicadangkan

EUR/USD. 12 Jun. Tekanan Terbaharu ke Atas Dolar

Selamat sejahtera, para pedagang yang dihormati! Pada hari Rabu, pasangan EUR/USD meneruskan pergerakan menaik setelah melantun semula dari zon sokongan 1.1374–1.1380. Ia berjaya disokong di atas tahap pemulihan semula Fibonacci

Samir Klishi 10:15 2025-06-12 UTC+2

GBP/USD. 12 Jun. Ekonomi Britain Melemah

Selamat sejahtera, para pedagang yang dihormati! Pada carta sejam, pada hari Rabu, pasangan GBP/USD telah berbalik memihak kepada pound Britain dan membuat pengukuhan di atas paras anjakan semula Fibonacci 161.8%

Samir Klishi 10:15 2025-06-12 UTC+2

Analisis Teknikal Pergerakan Harga Harian Instrumen Komoditi Minyak Mentah, Khamis 12 Jun 2025.

Jika kita melihat carta harian bagi instrumen komoditi Minyak Mentah, terdapat Perbezaan di antara pergerakan harga #CL dan penunjuk Pengayun Stochastic, yang menunjukkan kemungkinan #CL akan mengalami pembetulan penyusutan dalam

Arief Makmur 08:10 2025-06-12 UTC+2

Analisis Teknikal Pergerakan Harga Harian Indeks Nasdaq 100, Khamis 12 Jun 2025.

Pada carta 4 jam indeks Nasdaq 100, terdapat perbezaan antara pergerakan harga dan penunjuk Pengayun Stochastic, terutamanya dengan pengesahan pergerakan harga semasa #NDX yang bergerak di bawah EMA (21), maka

Arief Makmur 08:10 2025-06-12 UTC+2

Isyarat Dagangan untuk EUR/USD bagi 12-19 Jun, 2025: jual di bawah 1.1500 (21 SMA - 8/8 Murray)

Jika harga euro jatuh di bawah 1.1500 dalam beberapa jam akan datang, ini boleh dilihat sebagai peluang untuk menjual. Dari sudut teknikal, ia kelihatan terlebih belian pada carta

Dimitrios Zappas 05:33 2025-06-12 UTC+2

Isyarat Dagangan EMAS (XAU/USD) untuk 12-19 Jun 2025: jual di bawah $3,386 (21 SMA - 7/8 Murray)

Aliran XAU/USD kekal dalam fasa kenaikan selagi harga terus membuat pengukuhan di atas paras 3,331. Oleh demikian, adalah wajar untuk membeli emas selagi harga terus membuat pengukuhan di atas paras

Dimitrios Zappas 05:32 2025-06-12 UTC+2

Ramalan EUR/USD untuk 12 Jun 2025

Data inflasi A.S. yang dikeluarkan pada hari Rabu telah menggoyahkan pasaran: indeks dolar menurun sebanyak 0.47%, minyak WTI melonjak sebanyak 5.54%, emas meningkat sebanyak 1.27%, dan hasil Perbendaharaan A.S

Laurie Bailey 04:40 2025-06-12 UTC+2

Ramalan GBP/USD untuk 12 Jun 2025

Pada hari Rabu, pound British berjaya mengelakkan penurunan di bawah paras sokongan teknikal, lalu berbalik naik dari paras tersebut. Harga membuat lantunan dari garisan penunjuk MACD pada carta harian, manakala

Laurie Bailey 04:40 2025-06-12 UTC+2

Ramalan USD/JPY untuk 12 Jun 2025

Pembetulan harga sejak 27 Mei adalah kompleks dan berlarutan, sekali gus menimbulkan risiko penembusan melebihi paras 146.11. Namun, risiko ini kini tidak lagi menjadi kebimbangan berikutan pembalikan dari paras 145.08

Laurie Bailey 04:40 2025-06-12 UTC+2

Bitcoin: Kekuatan Dolar Boleh Mencetuskan Kejatuhan dalam Pasaran Kripto

Hari ini, tumpuan utama pasaran akan diberikan kepada penerbitan laporan inflasi Amerika Syarikat, yang dijangkakan bukan sahaja menunjukkan penghentian penurunan baru-baru ini, malah mencatatkan kenaikan inflasi tertinggi dalam tempoh empat

Pati Gani 11:47 2025-06-11 UTC+2
Tidak boleh bertanya sekarang?
Tanya soalan anda di Ruangan bersembang.
Panggilan semula Widget
 

Dear visitor,

Your IP address shows that you are currently located in the USA. If you are a resident of the United States, you are prohibited from using the services of InstaFintech Group including online trading, online transfers, deposit/withdrawal of funds, etc.

If you think you are seeing this message by mistake and your location is not the US, kindly proceed to the website. Otherwise, you must leave the website in order to comply with government restrictions.

Why does your IP address show your location as the USA?

  • - you are using a VPN provided by a hosting company based in the United States;
  • - your IP does not have proper WHOIS records;
  • - an error occurred in the WHOIS geolocation database.

Please confirm whether you are a US resident or not by clicking the relevant button below. If you choose the wrong option, being a US resident, you will not be able to open an account with InstaForex anyway.

We are sorry for any inconvenience caused by this message.