empty
22.08.2024 01:51 PM
EUR/USD. August 22. Business activity index cools down buyer enthusiasm

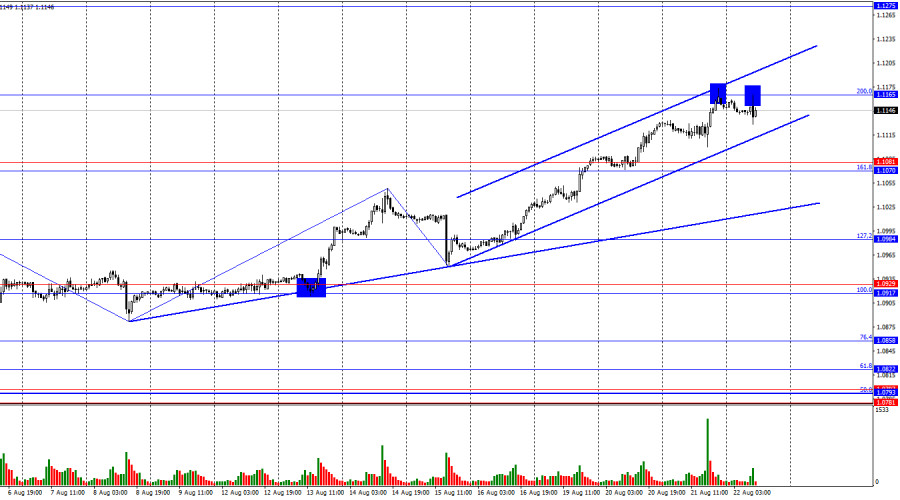
On Wednesday, the EUR/USD pair rose to the 200.0% corrective level at 1.1165. Two rejections from this level currently suggest a possible reversal in favor of the U.S. dollar and a slight decline toward the support zone of 1.1070–1.1081. However, it is not certain that the price will manage to consolidate below the upward trend channel, as the "bullish" trend remains very strong. The pair's growth would likely have continued this morning if the Eurozone business activity indices hadn't been weaker than expected. Consolidation above the 1.1165 level would signal a further rise toward the next Fibonacci level of 261.8% at 1.1318.

This image is no longer relevant

The wave situation has become a bit more complex but remains clear overall. The last completed downward wave did not break the low of the previous wave, while the new upward wave broke the peak from August 14. Thus, the "bullish" trend is still intact. For the "bullish" trend to be invalidated, the bears would need to break the low of the last downward wave, which is near the 1.0950 level.

The news flow on Wednesday was nearly nonexistent. Only in the second half of the day did the new Nonfarm Payrolls report (in annual terms) come in weaker than market expectations, triggering a new decline in the U.S. dollar. However, in my view, the decline of the U.S. currency would have continued even without this report, just as it did on Monday or Tuesday. This morning, business activity reports were released in Germany and the Eurozone. Three out of four indicators were weaker than expected. The only positive was the Eurozone services PMI, which rose from 51.9 to 53.3 points. As we can see, the impact of this information was only enough to pause the continuous growth. I don't believe that this pause marks the end. Typically, trends end abruptly, and we are not seeing any sharp reversals at the moment.

This image is no longer relevant

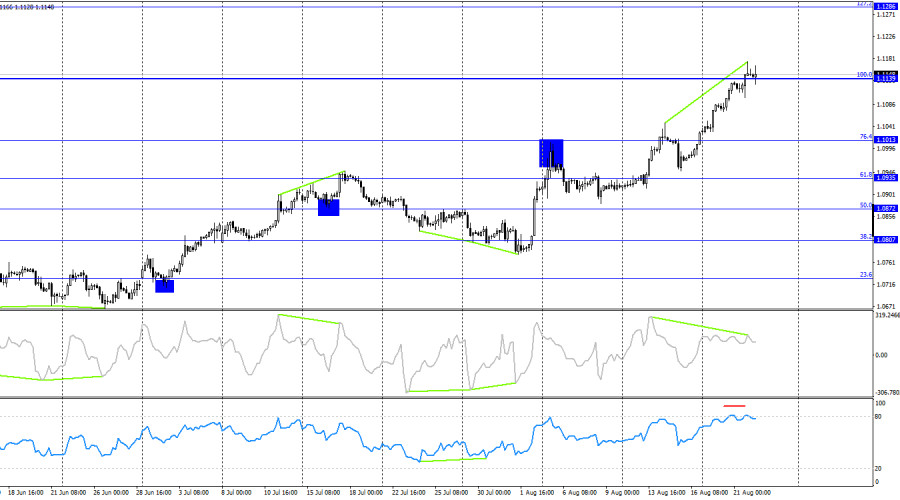
On the 4-hour chart, the pair rose to the 100.0% Fibonacci level at 1.1139 and held just above it. The CCI indicator has been signaling a "bearish" divergence for several days, and the RSI is in overbought territory. Thus, many factors suggest a potential decline in the pair by the end of the week. However, significant growth for the dollar seems unlikely at this point. Even if a downward trend begins, it will take quite some time to obtain the necessary confirmations. For now, I only anticipate a slight downward correction.

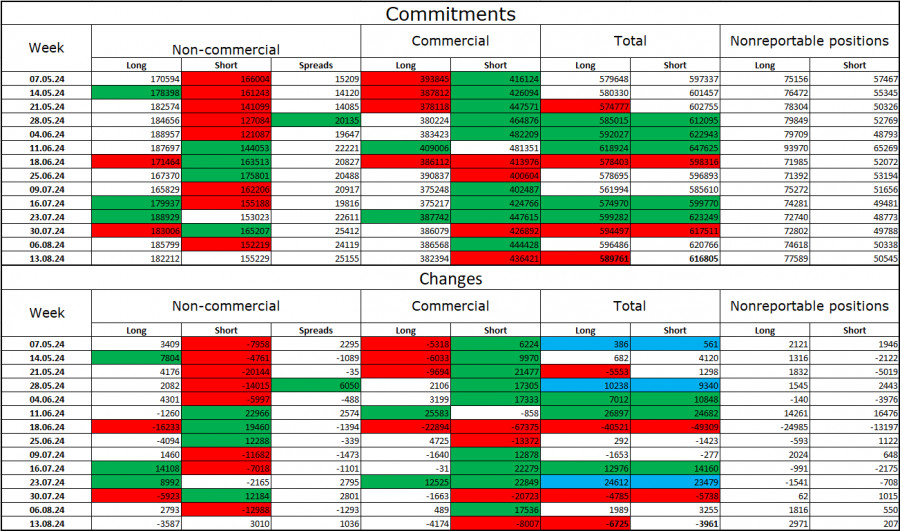
Commitments of Traders (COT) Report:

This image is no longer relevant

During the last reporting week, speculators closed 3,587 long positions and opened 3,010 short positions. The sentiment of the "Non-commercial" group turned "bearish" several months ago, but bulls have regained dominance. The total number of long positions held by speculators is now 182,000, while short positions total 155,000.

I still believe that the situation will continue to shift in favor of the bears. I see no long-term reasons to buy the euro, as the ECB's monetary easing will reduce yields on bank deposits and government bonds. In the U.S., yields are likely to remain high at least until September, making the dollar more attractive to investors. The potential for a euro decline is significant. However, one should not overlook the technical analysis, which currently does not suggest a strong fall for the euro.

News Calendar for the U.S. and Eurozone:

  • Eurozone – Germany Manufacturing PMI (07:30 UTC)
  • Eurozone – Germany Services PMI (07:30 UTC)
  • Eurozone – Manufacturing PMI (08:00 UTC)
  • Eurozone – Services PMI (08:00 UTC)
  • U.S. – Initial Jobless Claims (12:30 UTC)
  • U.S. – Manufacturing PMI (13:45 UTC)
  • U.S. – Services PMI (13:45 UTC)

On August 22, the economic calendar contains a significant number of entries. The impact of the information background on trader sentiment will be notable for the first time this week.

Forecast for EUR/USD and Trading Tips:

Selling the pair today can be considered on a rebound from the 1.1165 level on the hourly chart, targeting 1.1070–1.1081. Purchases were possible upon closing above the 1.1080 level on the hourly chart with a target of 1.1140, which was reached. New long positions can be considered upon the formation of buy signals near the levels of 1.1070–1.1081 or 1.1165 on the hourly chart.

Fibonacci grids are constructed from 1.0917–1.0668 on the hourly chart and from 1.1139–1.0603 on the 4-hour chart.

Ringkasan
Segera
Analitic
Grigory Sokolov
Mulakan perdagangan
Jana pendapatan melalui perubahan kadar mata wang kripto dengan InstaForex.
Muat turun MetaTrader 4 dan buka dagangan pertama anda.
  • Grand Choice
    Contest by
    InstaForex
    InstaForex always strives to help you
    fulfill your biggest dreams.
    SERTAI PERADUAN

Artikel yang dicadangkan

Ramalan untuk GBP/USD pada 11 Julai 2025

Pada carta satu jam, pasangan GBP/USD pada hari Khamis telah membuat lantunan semula dari zon rintangan 1.3611–1.3633 dan menyambung semula penurunannya ke arah paras Fibonacci 127.2% pada 1.3527. Lantunan semula

Samir Klishi 12:20 2025-07-11 UTC+2

XAU/USD 11 Julai 2025 (Jumaat): Potensi Pengukuhan Emas Masih Kukuh Walaupun Berisiko Mengalami Pembetulan

XAU/USD, Jumaat, 11 Julai 2025. Walaupun harga emas kelihatan mengalami sedikit pembetulan selepas tertahan di tahap rintangan pertama (R1), kombinasi faktor teknikal dan fundamental masih menyokong potensi pengukuhan XAU/USD pada

Arief Makmur 08:00 2025-07-11 UTC+2

Ramalan EUR/USD untuk 11 Julai 2025

EUR/USD Pada carta mingguan, kami perhatikan satu set isyarat pembalikan: perbezaan, perubahan arah aliran dalam zon masa Fibonacci, dan lantunan harga dari persilangan dua garisan kuat — sempadan saluran harga

Laurie Bailey 06:58 2025-07-11 UTC+2

Ramalan GBP/USD untuk 11 Julai 2025

Pada carta bulanan, pound British telah berundur dari paras reaksi Fibonacci 161.8%, yang dikira dari sempadan atas saluran harga global 18 tahun, tepat selepas garisan masa Fibonacci ke-8. Penurunan jangka

Laurie Bailey 06:46 2025-07-11 UTC+2

Ramalan USD/CAD untuk 11 Julai 2025

Dolar Kanada telah berada dalam fasa pengukuhan selama tiga hari sebelum berlaku penembusan menaik pada sesi dagangan Pasifik hari ini. Harga telah menembusi garisan keseimbangan dengan bayang atas graf lilin

Laurie Bailey 06:42 2025-07-11 UTC+2

Ramalan bagi EUR/USD pada 10 Julai 2025

Pada hari Rabu, pasangan EUR/USD terus bergerak mengikut trajektori yang hanya diketahui oleh dirinya sendiri. Tahap pembetulan Fibonacci 127.2% pada 1.1712 sekali lagi diabaikan oleh pedagang. Saya masih tidak mengesyorkan

Samir Klishi 12:21 2025-07-10 UTC+2

Ramalan untuk GBP/USD pada 10 Julai 2025

Pada carta setiap jam, pasangan GBP/USD meneruskan pergerakan menaiknya pada hari Rabu selepas melantun dari paras pembetulan Fibonacci 127.2% di 1.3527. Lantunan tersebut berlaku dengan ketepatan tinggi, membawa kepada pembalikan

Samir Klishi 10:35 2025-07-10 UTC+2

GBP/JPY. Analisis, Ramalan, dan Situasi Pasaran Semasa

Pada hari Khamis, pasangan GBP/JPY sedang mendapatkan semula momentum kenaikan dan menunjukkan kesediaan untuk pertumbuhan lebih lanjut. Pembentukan saluran menaik mengesahkan kestabilan aliran kenaikan. Semasa sesi Asia, pembeli menjadi lebih

Irina Yanina 10:22 2025-07-10 UTC+2

Jika paras rintangan 0.7964 berjaya menahan pergerakan menaiknya, USD/CHF berpotensi untuk melemah pada hari Khamis, 10 Julai 2025.

USD/CHF, Khamis, 10 Julai 2025 Selain khabar angin mengenai rancangan pemotongan kadar faedah oleh Rizab Persekutuan serta kejatuhan hasil bon kerajaan AS, pasangan USD/CHF melemah pada hari ini. Paras Utama

Arief Makmur 06:47 2025-07-10 UTC+2

Pound Sterling Berpotensi Uji Tahap Pivot dan Sokongan 1 – Khamis, 10 Julai 2025

GBP/USD, Khamis, 10 Julai 2025. Pasangan GBP/USD berpotensi mengukuh semula hari ini, didorong oleh spekulasi pasaran mengenai kemungkinan pendekatan dovish oleh Rizab Persekutuan AS dalam masa terdekat. Khabar angin

Arief Makmur 06:47 2025-07-10 UTC+2
Tidak boleh bertanya sekarang?
Tanya soalan anda di Ruangan bersembang.
Panggilan semula Widget
 

Dear visitor,

Your IP address shows that you are currently located in the USA. If you are a resident of the United States, you are prohibited from using the services of InstaFintech Group including online trading, online transfers, deposit/withdrawal of funds, etc.

If you think you are seeing this message by mistake and your location is not the US, kindly proceed to the website. Otherwise, you must leave the website in order to comply with government restrictions.

Why does your IP address show your location as the USA?

  • - you are using a VPN provided by a hosting company based in the United States;
  • - your IP does not have proper WHOIS records;
  • - an error occurred in the WHOIS geolocation database.

Please confirm whether you are a US resident or not by clicking the relevant button below. If you choose the wrong option, being a US resident, you will not be able to open an account with InstaForex anyway.

We are sorry for any inconvenience caused by this message.