

signal strength 1 of 5
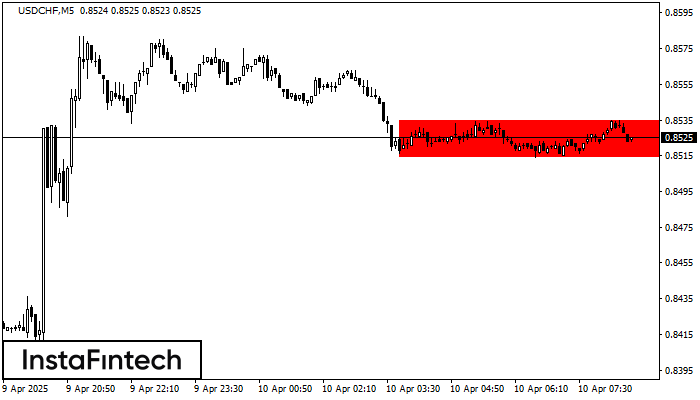
According to the chart of M5, USDCHF formed the Bearish Rectangle which is a pattern of a trend continuation. The pattern is contained within the following borders: lower border 0.8514 – 0.8514 and upper border 0.8535 – 0.8535. In case the lower border is broken, the instrument is likely to follow the downward trend.
The M5 and M15 time frames may have more false entry points.
See Also
- All
- Double Top
- Flag
- Head and Shoulders
- Pennant
- Rectangle
- Triangle
- Triple top
- All
- #AAPL
- #AMZN
- #Bitcoin
- #EBAY
- #FB
- #GOOG
- #INTC
- #KO
- #MA
- #MCD
- #MSFT
- #NTDOY
- #PEP
- #TSLA
- #TWTR
- AUDCAD
- AUDCHF
- AUDJPY
- AUDUSD
- EURCAD
- EURCHF
- EURGBP
- EURJPY
- EURNZD
- EURRUB
- EURUSD
- GBPAUD
- GBPCHF
- GBPJPY
- GBPUSD
- GOLD
- NZDCAD
- NZDCHF
- NZDJPY
- NZDUSD
- SILVER
- USDCAD
- USDCHF
- USDJPY
- USDRUB
- All
- M5
- M15
- M30
- H1
- D1
- All
- Buy
- Sale
- All
- 1
- 2
- 3
- 4
- 5
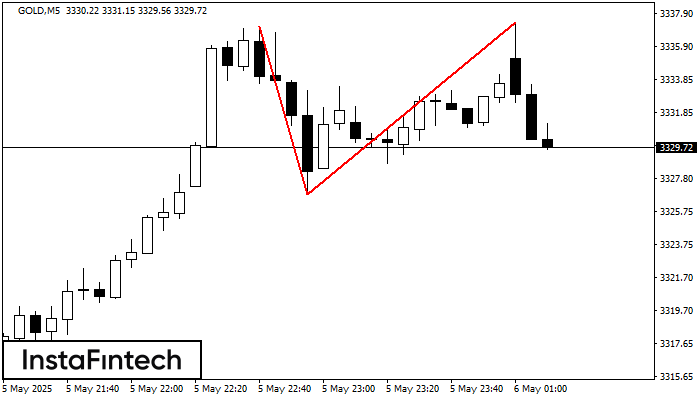
The Double Top pattern has been formed on GOLD M5. It signals that the trend has been changed from upwards to downwards. Probably, if the base of the pattern 3326.83
The M5 and M15 time frames may have more false entry points.
Open chart in a new window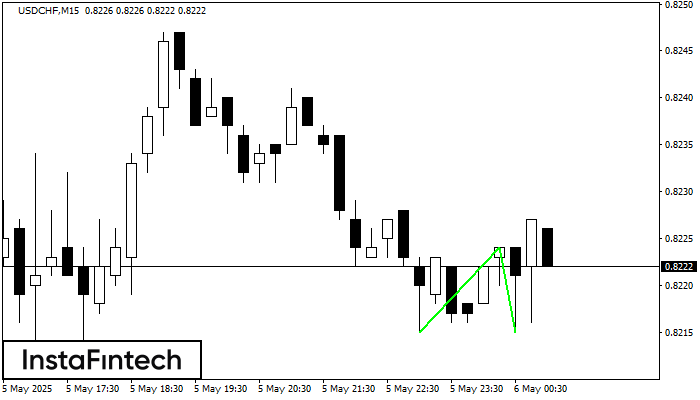
The Double Bottom pattern has been formed on USDCHF M15; the upper boundary is 0.8224; the lower boundary is 0.8215. The width of the pattern is 9 points. In case
The M5 and M15 time frames may have more false entry points.
Open chart in a new window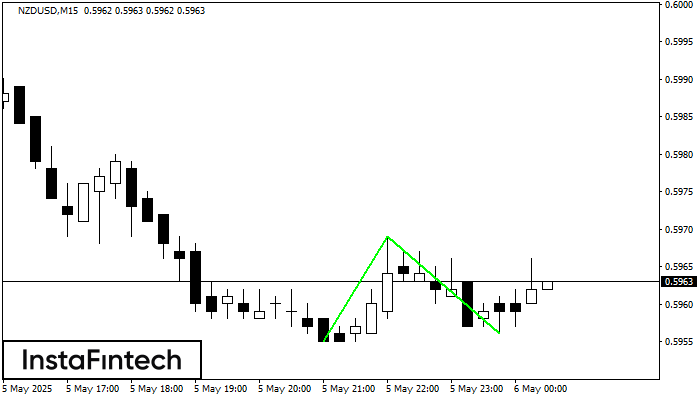
The Double Bottom pattern has been formed on NZDUSD M15. Characteristics: the support level 0.5955; the resistance level 0.5969; the width of the pattern 14 points. If the resistance level
The M5 and M15 time frames may have more false entry points.
Open chart in a new window


