signal strength 2 of 5
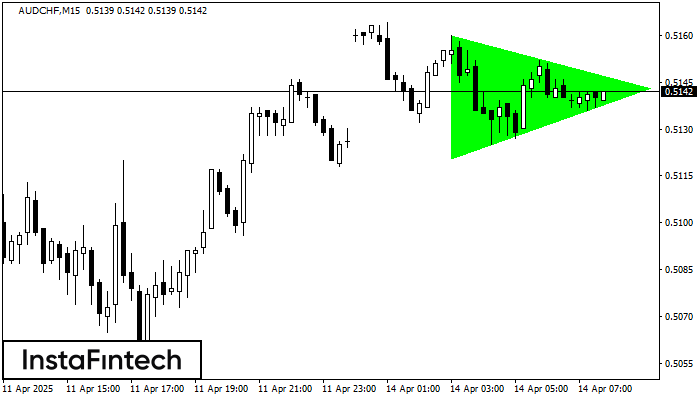
According to the chart of M15, AUDCHF formed the Bullish Symmetrical Triangle pattern, which signals the trend will continue. Description. The upper border of the pattern touches the coordinates 0.5160/0.5143 whereas the lower border goes across 0.5120/0.5143. The pattern width is measured on the chart at 40 pips. If the Bullish Symmetrical Triangle pattern is in progress during the upward trend, this indicates the current trend will go on. In case 0.5143 is broken, the price could continue its move toward 0.5166.
The M5 and M15 time frames may have more false entry points.
See Also
- All
- Double Top
- Flag
- Head and Shoulders
- Pennant
- Rectangle
- Triangle
- Triple top
- All
- #AAPL
- #AMZN
- #Bitcoin
- #EBAY
- #FB
- #GOOG
- #INTC
- #KO
- #MA
- #MCD
- #MSFT
- #NTDOY
- #PEP
- #TSLA
- #TWTR
- AUDCAD
- AUDCHF
- AUDJPY
- AUDUSD
- EURCAD
- EURCHF
- EURGBP
- EURJPY
- EURNZD
- EURRUB
- EURUSD
- GBPAUD
- GBPCHF
- GBPJPY
- GBPUSD
- GOLD
- NZDCAD
- NZDCHF
- NZDJPY
- NZDUSD
- SILVER
- USDCAD
- USDCHF
- USDJPY
- USDRUB
- All
- M5
- M15
- M30
- H1
- D1
- All
- Buy
- Sale
- All
- 1
- 2
- 3
- 4
- 5

Según el gráfico de M30, EURGBP formó el Rectángulo Bajista. Este tipo de patrón indica la continuación de una tendencia. Esto consiste de dos niveles: resistencia 0.8574 - 0.0000
Open chart in a new window
El patrón Triple Piso ha formado en el gráfico del instrumento de negociación NZDCAD M5. El patrón señala un cambio en la tendencia de bajista a alcista en caso
Los marcos de tiempo M5 y M15 pueden tener más puntos de entrada falsos.
Open chart in a new window
El patrón Triple Piso ha sido formado en NZDJPY M15. Este tiene las siguientes características: nivel de resistencia 84.49/84.47; nivel de soporte 84.31/84.32; el ancho es 18 puntos. En caso
Los marcos de tiempo M5 y M15 pueden tener más puntos de entrada falsos.
Open chart in a new window