

was formed on 24.04 at 21:22:37 (UTC+0)
signal strength 1 of 5
signal strength 1 of 5
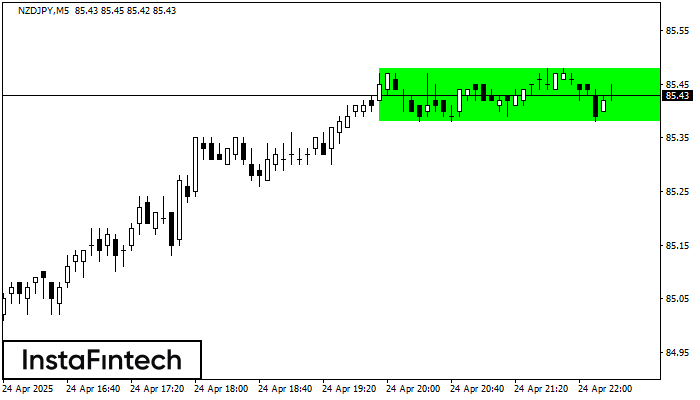
According to the chart of M5, NZDJPY formed the Bullish Rectangle. The pattern indicates a trend continuation. The upper border is 85.48, the lower border is 85.38. The signal means that a long position should be opened above the upper border 85.48 of the Bullish Rectangle.
The M5 and M15 time frames may have more false entry points.
Figure
Instrument
Timeframe
Trend
Signal Strength


