

signal strength 1 of 5
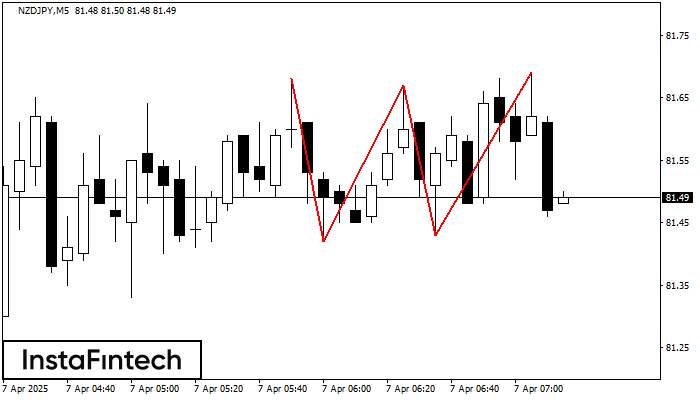
The Triple Top pattern has formed on the chart of the NZDJPY M5 trading instrument. It is a reversal pattern featuring the following characteristics: resistance level -1, support level -1, and pattern’s width 26. Forecast If the price breaks through the support level 81.42, it is likely to move further down to 81.52.
The M5 and M15 time frames may have more false entry points.
Veja também
- All
- Double Top
- Flag
- Head and Shoulders
- Pennant
- Rectangle
- Triangle
- Triple top
- All
- #AAPL
- #AMZN
- #Bitcoin
- #EBAY
- #FB
- #GOOG
- #INTC
- #KO
- #MA
- #MCD
- #MSFT
- #NTDOY
- #PEP
- #TSLA
- #TWTR
- AUDCAD
- AUDCHF
- AUDJPY
- AUDUSD
- EURCAD
- EURCHF
- EURGBP
- EURJPY
- EURNZD
- EURRUB
- EURUSD
- GBPAUD
- GBPCHF
- GBPJPY
- GBPUSD
- GOLD
- NZDCAD
- NZDCHF
- NZDJPY
- NZDUSD
- SILVER
- USDCAD
- USDCHF
- USDJPY
- USDRUB
- All
- M5
- M15
- M30
- H1
- D1
- All
- Buy
- Sale
- All
- 1
- 2
- 3
- 4
- 5
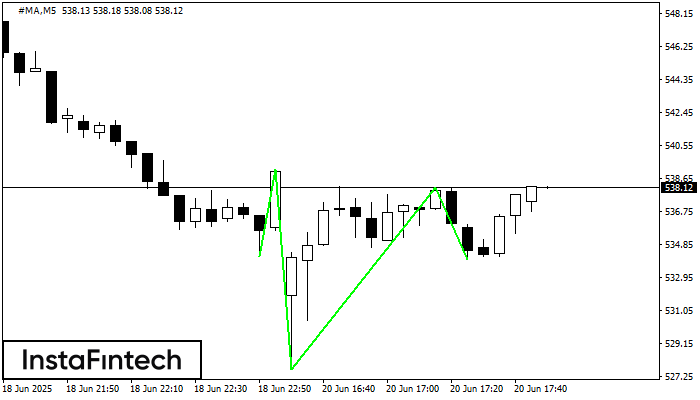
According to the chart of M5, #MA formed the Inverse Head and Shoulder pattern. The Head’s top is set at 538.15 while the median line of the Neck is found
The M5 and M15 time frames may have more false entry points.
Open chart in a new window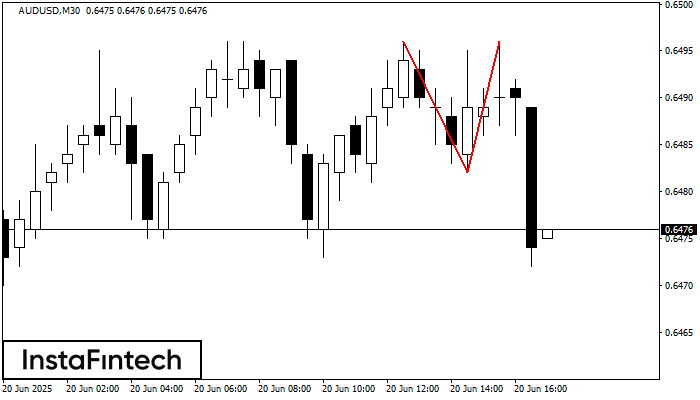
On the chart of AUDUSD M30 the Double Top reversal pattern has been formed. Characteristics: the upper boundary 0.6496; the lower boundary 0.6482; the width of the pattern 14 points
Open chart in a new window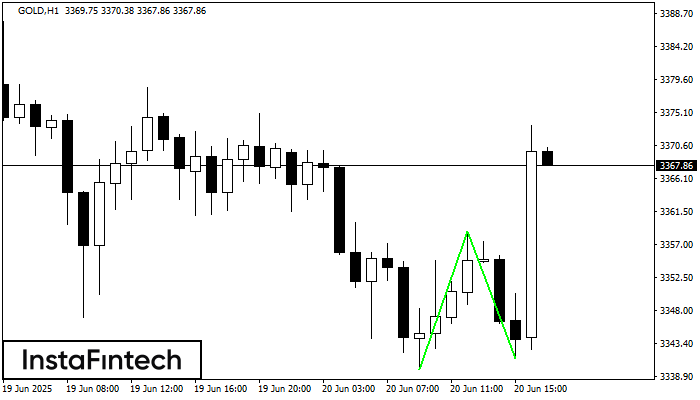
The Double Bottom pattern has been formed on GOLD H1. Characteristics: the support level 3339.89; the resistance level 3358.78; the width of the pattern 1889 points. If the resistance level
Open chart in a new window


