


signal strength 1 of 5
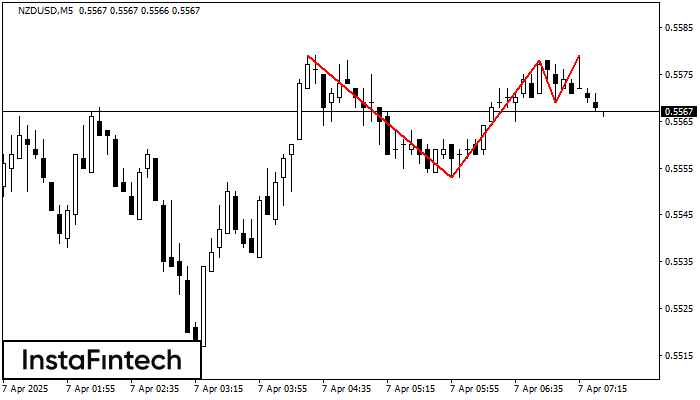
The Triple Top pattern has formed on the chart of the NZDUSD M5. Features of the pattern: borders have an ascending angle; the lower line of the pattern has the coordinates 0.5553/0.5569 with the upper limit 0.5579/0.5579; the projection of the width is 26 points. The formation of the Triple Top figure most likely indicates a change in the trend from upward to downward. This means that in the event of a breakdown of the support level of 0.5553, the price is most likely to continue the downward movement.
The M5 and M15 time frames may have more false entry points.
Veja também
- All
- Double Top
- Flag
- Head and Shoulders
- Pennant
- Rectangle
- Triangle
- Triple top
- All
- #AAPL
- #AMZN
- #Bitcoin
- #EBAY
- #FB
- #GOOG
- #INTC
- #KO
- #MA
- #MCD
- #MSFT
- #NTDOY
- #PEP
- #TSLA
- #TWTR
- AUDCAD
- AUDCHF
- AUDJPY
- AUDUSD
- EURCAD
- EURCHF
- EURGBP
- EURJPY
- EURNZD
- EURRUB
- EURUSD
- GBPAUD
- GBPCHF
- GBPJPY
- GBPUSD
- GOLD
- NZDCAD
- NZDCHF
- NZDJPY
- NZDUSD
- SILVER
- USDCAD
- USDCHF
- USDJPY
- USDRUB
- All
- M5
- M15
- M30
- H1
- D1
- All
- Buy
- Sale
- All
- 1
- 2
- 3
- 4
- 5
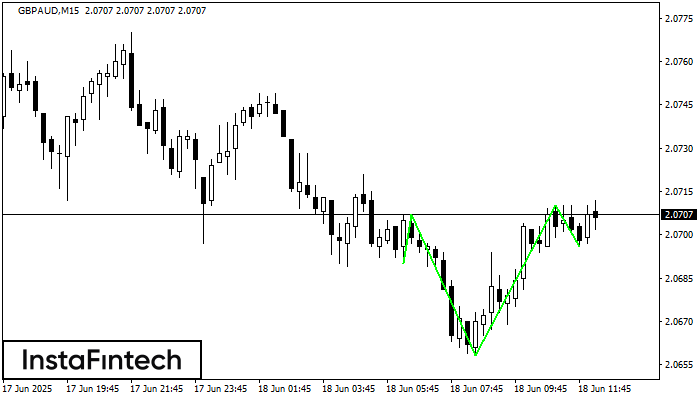
De acordo com o gráfico de M15, GBPAUD produziu o padrão denominado Cabeça & Ombro Invertidos. A Cabeça é definida em 2.0658 enquanto a linha mediana do Pescoço é definida
Os intervalos M5 e M15 podem ter mais pontos de entrada falsos.
Open chart in a new window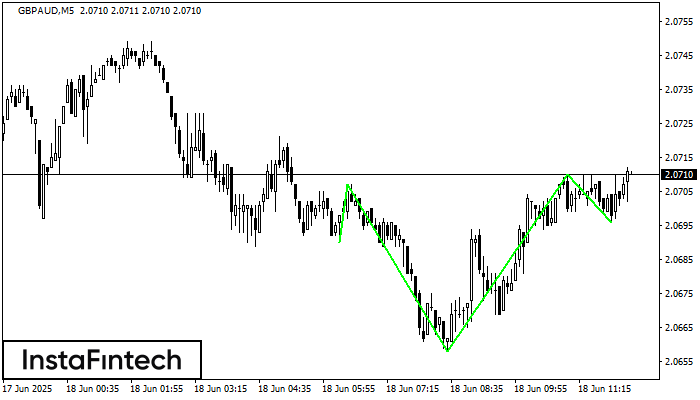
De acordo com M5, GBPAUD está moldando o padrão técnico – os Cabeça & Ombro Invertidos. Caso a linha de pescoço 2.0707/2.0710 seja quebrada, o instrumento provavelmente se moverá para
Os intervalos M5 e M15 podem ter mais pontos de entrada falsos.
Open chart in a new window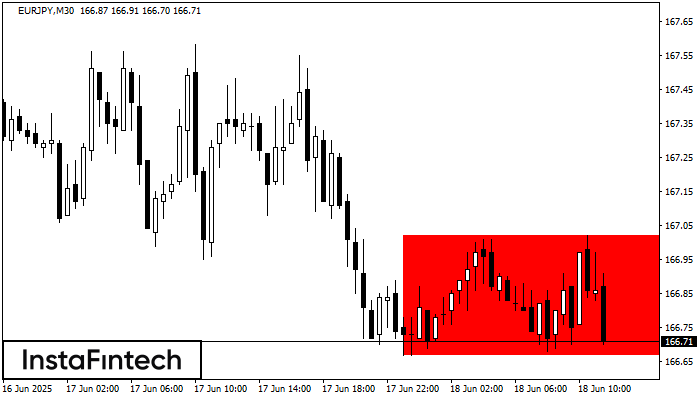
De acordo com o gráfico de M30, EURJPY formou Retângulo de baixa. Este tipo de padrão indica uma continuação da tendência. Ele consiste em dois níveis: resistência 167.02 – 0.00
Open chart in a new window


