


signal strength 1 of 5
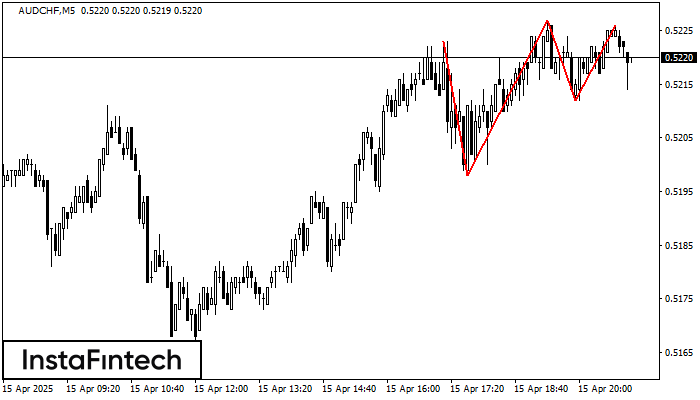
The Triple Top pattern has formed on the chart of the AUDCHF M5. Features of the pattern: borders have an ascending angle; the lower line of the pattern has the coordinates 0.5198/0.5212 with the upper limit 0.5223/0.5226; the projection of the width is 25 points. The formation of the Triple Top figure most likely indicates a change in the trend from upward to downward. This means that in the event of a breakdown of the support level of 0.5198, the price is most likely to continue the downward movement.
The M5 and M15 time frames may have more false entry points.
Veja também
- All
- Double Top
- Flag
- Head and Shoulders
- Pennant
- Rectangle
- Triangle
- Triple top
- All
- #AAPL
- #AMZN
- #Bitcoin
- #EBAY
- #FB
- #GOOG
- #INTC
- #KO
- #MA
- #MCD
- #MSFT
- #NTDOY
- #PEP
- #TSLA
- #TWTR
- AUDCAD
- AUDCHF
- AUDJPY
- AUDUSD
- EURCAD
- EURCHF
- EURGBP
- EURJPY
- EURNZD
- EURRUB
- EURUSD
- GBPAUD
- GBPCHF
- GBPJPY
- GBPUSD
- GOLD
- NZDCAD
- NZDCHF
- NZDJPY
- NZDUSD
- SILVER
- USDCAD
- USDCHF
- USDJPY
- USDRUB
- All
- M5
- M15
- M30
- H1
- D1
- All
- Buy
- Sale
- All
- 1
- 2
- 3
- 4
- 5
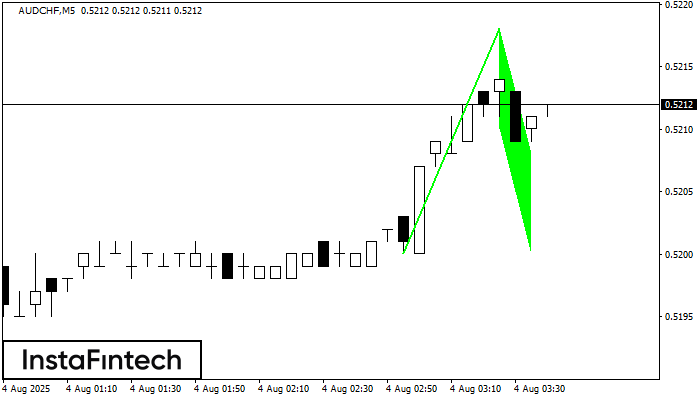
O padrão Bandeira de Alta foi formado em AUDCHF a M5. O limite inferior do padrão está localizado em 0.5210/0.5200, enquanto o limite superior está em 0.5218/0.5208. A projeção
Os intervalos M5 e M15 podem ter mais pontos de entrada falsos.
Open chart in a new window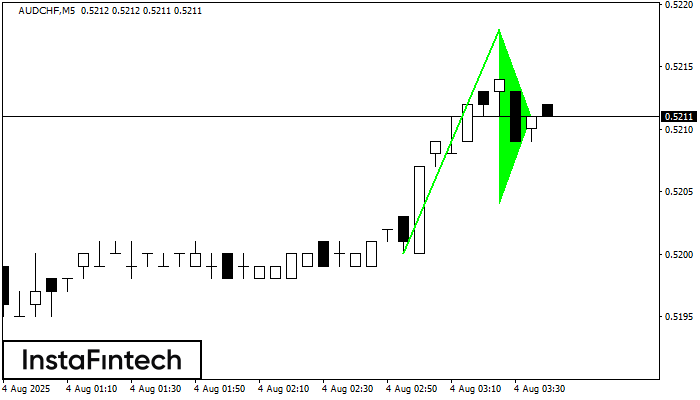
O sinal de Pennant de alta – Instrumento de negociação AUDCHF M5, padrão de continuação. Previsão: é possível definir uma posição de compra acima da altura do padrão de 0.5218
Os intervalos M5 e M15 podem ter mais pontos de entrada falsos.
Open chart in a new window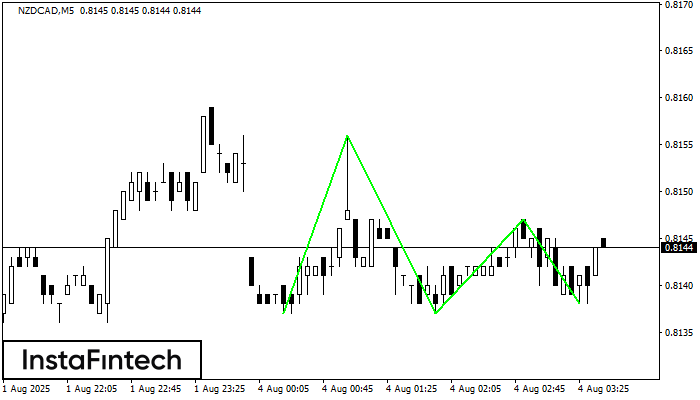
O padrão Fundo triplo foi formado no gráfico do instrumento de negociação NZDCAD M5. O padrão sinaliza uma mudança na tendência de baixa para alta no caso de quebra
Os intervalos M5 e M15 podem ter mais pontos de entrada falsos.
Open chart in a new window


