


signal strength 2 of 5

The Bearish Flag pattern has been formed on the chart AUDJPY M15 which signals that the downward trend will continue. If the price breaks below the low at 90.01, then it is most likely to move further downwards. The price will likely move by the number of points which equals the length of the flag pole (15 points).
The M5 and M15 time frames may have more false entry points.
- All
- Double Top
- Flag
- Head and Shoulders
- Pennant
- Rectangle
- Triangle
- Triple top
- All
- #AAPL
- #AMZN
- #Bitcoin
- #EBAY
- #FB
- #GOOG
- #INTC
- #KO
- #MA
- #MCD
- #MSFT
- #NTDOY
- #PEP
- #TSLA
- #TWTR
- AUDCAD
- AUDCHF
- AUDJPY
- AUDUSD
- EURCAD
- EURCHF
- EURGBP
- EURJPY
- EURNZD
- EURRUB
- EURUSD
- GBPAUD
- GBPCHF
- GBPJPY
- GBPUSD
- GOLD
- NZDCAD
- NZDCHF
- NZDJPY
- NZDUSD
- SILVER
- USDCAD
- USDCHF
- USDJPY
- USDRUB
- All
- M5
- M15
- M30
- H1
- D1
- All
- Buy
- Sale
- All
- 1
- 2
- 3
- 4
- 5
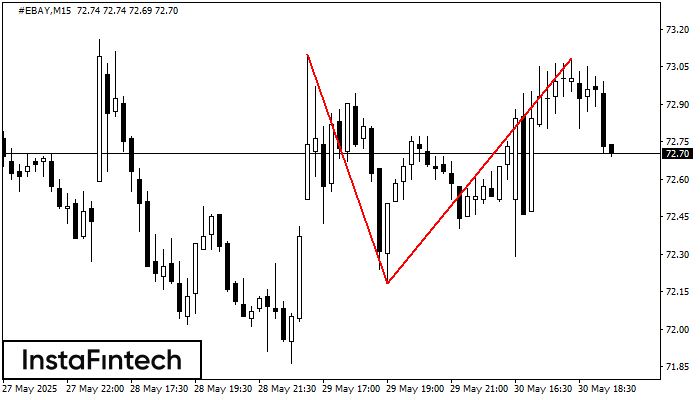
O padrão de reversão Topo duplo foi formado em #EBAY M15. Características: o limite superior 73.10; o limite inferior 72.18; a largura do padrão é de 90 pontos. As operações
Os intervalos M5 e M15 podem ter mais pontos de entrada falsos.
Open chart in a new window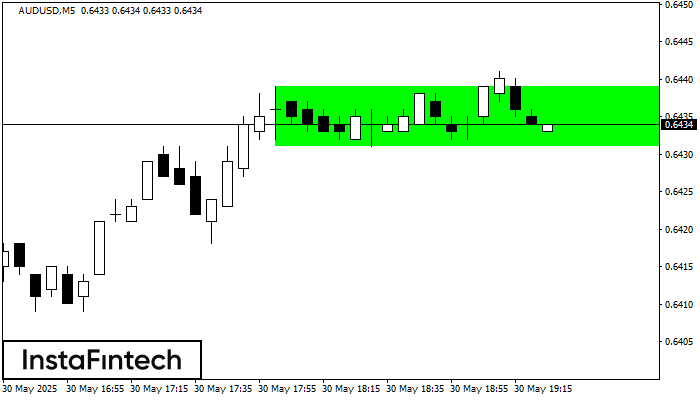
Conforme o gráfico de M5, AUDUSD formou o Retângulo de alta. Este tipo de padrão indica uma continuação da tendência. Ele consiste em dois níveis: resistência 0.6439 e suporte 0.6431
Os intervalos M5 e M15 podem ter mais pontos de entrada falsos.
Open chart in a new window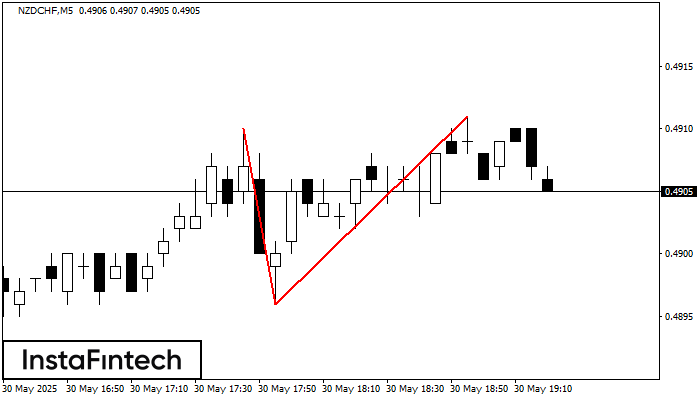
O padrão Topo duplo foi formado em NZDCHF M5. Isso sinaliza que a tendência foi alterada de cima para baixo. Provavelmente, se a base do padrão 0.4896 for quebrada
Os intervalos M5 e M15 podem ter mais pontos de entrada falsos.
Open chart in a new window


