

signal strength 4 of 5
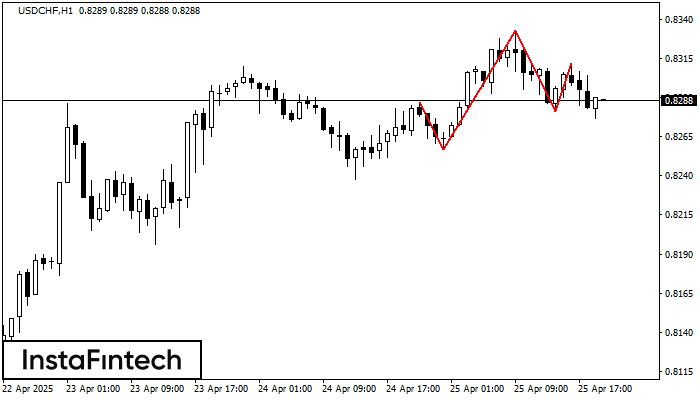
According to the chart of H1, USDCHF formed the Head and Shoulders pattern. The Head’s top is set at 0.8333 while the median line of the Neck is found at 0.8257/0.8281. The formation of the Head and Shoulders pattern evidently signals a reversal of the upward trend. In other words, in case the scenario comes true, the price of USDCHF will go towards 0.8241.
Veja também
- All
- Double Top
- Flag
- Head and Shoulders
- Pennant
- Rectangle
- Triangle
- Triple top
- All
- #AAPL
- #AMZN
- #Bitcoin
- #EBAY
- #FB
- #GOOG
- #INTC
- #KO
- #MA
- #MCD
- #MSFT
- #NTDOY
- #PEP
- #TSLA
- #TWTR
- AUDCAD
- AUDCHF
- AUDJPY
- AUDUSD
- EURCAD
- EURCHF
- EURGBP
- EURJPY
- EURNZD
- EURRUB
- EURUSD
- GBPAUD
- GBPCHF
- GBPJPY
- GBPUSD
- GOLD
- NZDCAD
- NZDCHF
- NZDJPY
- NZDUSD
- SILVER
- USDCAD
- USDCHF
- USDJPY
- USDRUB
- All
- M5
- M15
- M30
- H1
- D1
- All
- Buy
- Sale
- All
- 1
- 2
- 3
- 4
- 5
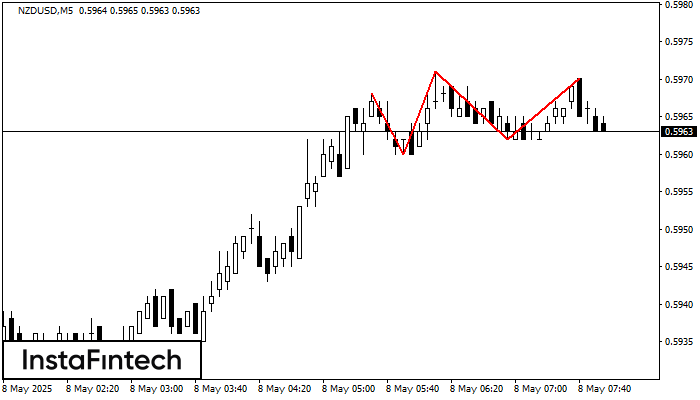
O padrão Topo triplo foi formado no gráfico do instrumento de negociação NZDUSD M5. É um padrão de reversão com as seguintes características: nível de resistência -2, nível de suporte
Os intervalos M5 e M15 podem ter mais pontos de entrada falsos.
Open chart in a new window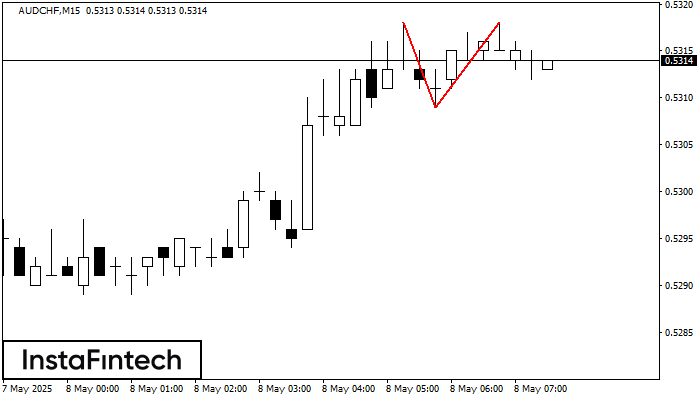
No gráfico de AUDCHF M15 o padrão de reversão Topo duplo foi formado. Características: o limite superior 0.5318; o limite inferior 0.5309; a largura do padrão 9 pontos. O sinal
Os intervalos M5 e M15 podem ter mais pontos de entrada falsos.
Open chart in a new window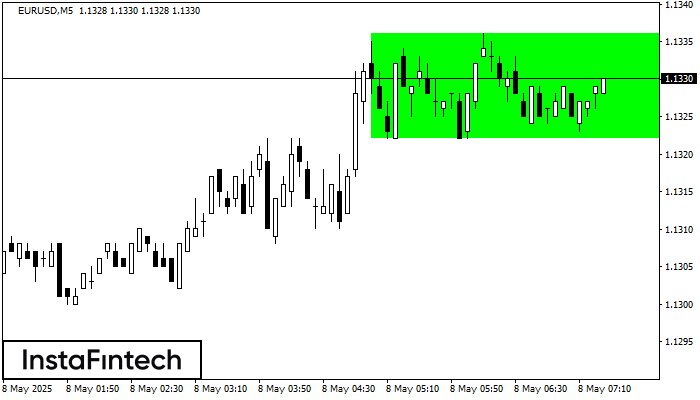
De acordo com o gráfico de M5, EURUSD formou Retângulo de alta. O padrão indica uma continuação da tendência. O limite superior é 1.1336, o limite inferior é 1.1322
Os intervalos M5 e M15 podem ter mais pontos de entrada falsos.
Open chart in a new window


