


signal strength 1 of 5
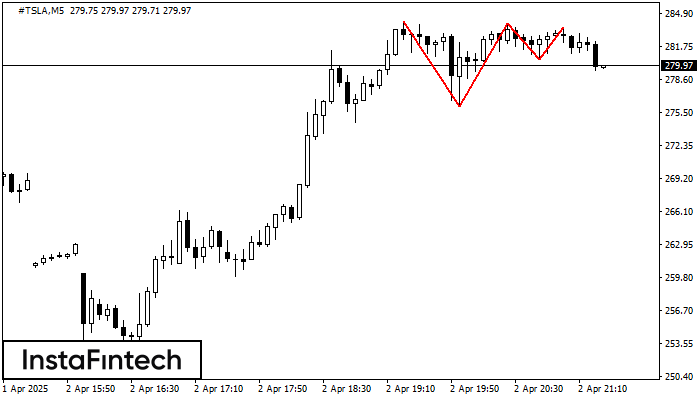
The Triple Top pattern has formed on the chart of the #TSLA M5 trading instrument. It is a reversal pattern featuring the following characteristics: resistance level 56, support level -444, and pattern’s width 805. Forecast If the price breaks through the support level 276.07, it is likely to move further down to 283.77.
The M5 and M15 time frames may have more false entry points.
See Also
- All
- Double Top
- Flag
- Head and Shoulders
- Pennant
- Rectangle
- Triangle
- Triple top
- All
- #AAPL
- #AMZN
- #Bitcoin
- #EBAY
- #FB
- #GOOG
- #INTC
- #KO
- #MA
- #MCD
- #MSFT
- #NTDOY
- #PEP
- #TSLA
- #TWTR
- AUDCAD
- AUDCHF
- AUDJPY
- AUDUSD
- EURCAD
- EURCHF
- EURGBP
- EURJPY
- EURNZD
- EURRUB
- EURUSD
- GBPAUD
- GBPCHF
- GBPJPY
- GBPUSD
- GOLD
- NZDCAD
- NZDCHF
- NZDJPY
- NZDUSD
- SILVER
- USDCAD
- USDCHF
- USDJPY
- USDRUB
- All
- M5
- M15
- M30
- H1
- D1
- All
- Buy
- Sale
- All
- 1
- 2
- 3
- 4
- 5
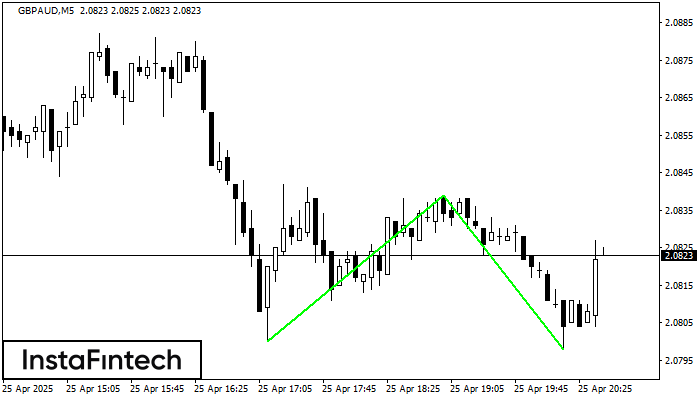
The Double Bottom pattern has been formed on GBPAUD M5. This formation signals a reversal of the trend from downwards to upwards. The signal is that a buy trade should
The M5 and M15 time frames may have more false entry points.
Открыть график инструмента в новом окне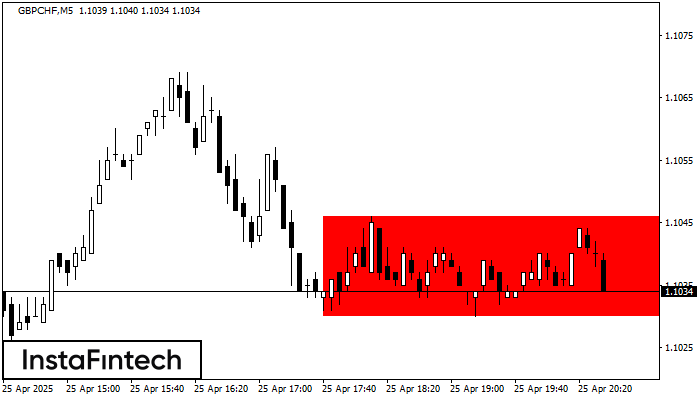
According to the chart of M5, GBPCHF formed the Bearish Rectangle. The pattern indicates a trend continuation. The upper border is 1.1046, the lower border is 1.1030. The signal means
The M5 and M15 time frames may have more false entry points.
Открыть график инструмента в новом окне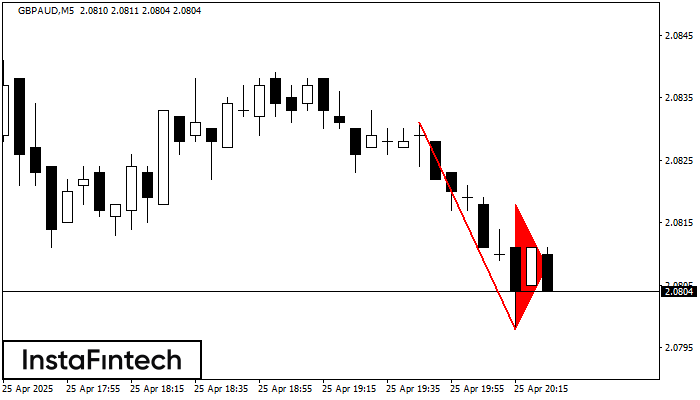
The Bearish pennant pattern has formed on the GBPAUD M5 chart. The pattern signals continuation of the downtrend in case the pennant’s low of 2.0798 is broken through. Recommendations: Place
The M5 and M15 time frames may have more false entry points.
Открыть график инструмента в новом окне


