


signal strength 3 of 5
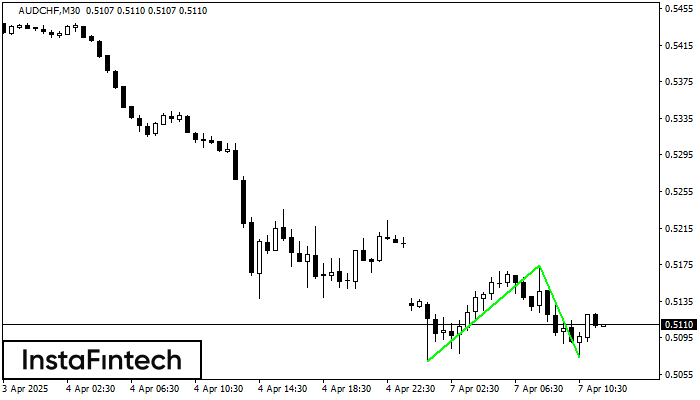
The Double Bottom pattern has been formed on AUDCHF M30. Characteristics: the support level 0.5069; the resistance level 0.5174; the width of the pattern 105 points. If the resistance level is broken, a change in the trend can be predicted with the first target point lying at the distance of 100 points.
- All
- Double Top
- Flag
- Head and Shoulders
- Pennant
- Rectangle
- Triangle
- Triple top
- All
- #AAPL
- #AMZN
- #Bitcoin
- #EBAY
- #FB
- #GOOG
- #INTC
- #KO
- #MA
- #MCD
- #MSFT
- #NTDOY
- #PEP
- #TSLA
- #TWTR
- AUDCAD
- AUDCHF
- AUDJPY
- AUDUSD
- EURCAD
- EURCHF
- EURGBP
- EURJPY
- EURNZD
- EURRUB
- EURUSD
- GBPAUD
- GBPCHF
- GBPJPY
- GBPUSD
- GOLD
- NZDCAD
- NZDCHF
- NZDJPY
- NZDUSD
- SILVER
- USDCAD
- USDCHF
- USDJPY
- USDRUB
- All
- M5
- M15
- M30
- H1
- D1
- All
- Buy
- Sale
- All
- 1
- 2
- 3
- 4
- 5
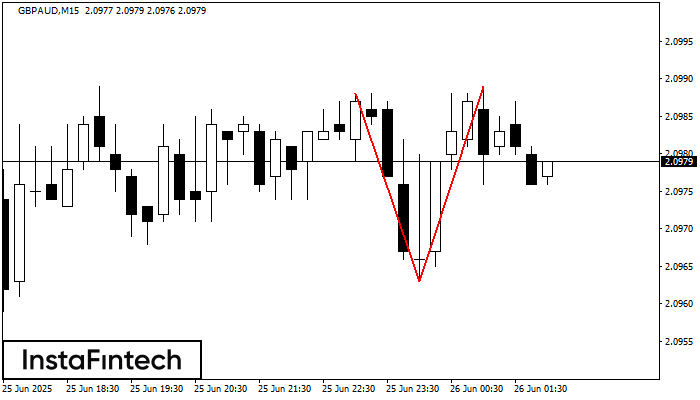
The Double Top pattern has been formed on GBPAUD M15. It signals that the trend has been changed from upwards to downwards. Probably, if the base of the pattern 2.0963
The M5 and M15 time frames may have more false entry points.
Открыть график инструмента в новом окне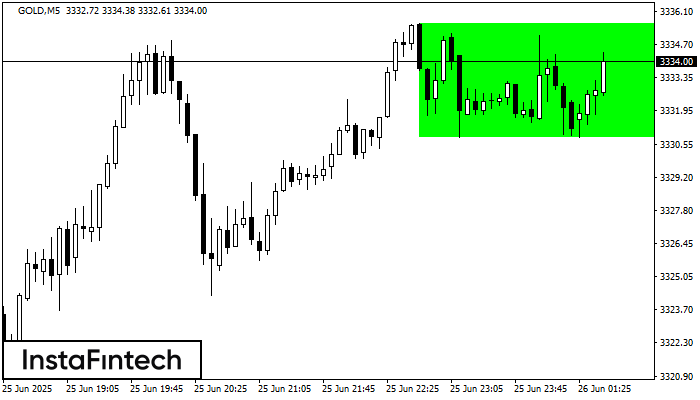
According to the chart of M5, GOLD formed the Bullish Rectangle. The pattern indicates a trend continuation. The upper border is 3335.60, the lower border is 3330.86. The signal means
The M5 and M15 time frames may have more false entry points.
Открыть график инструмента в новом окне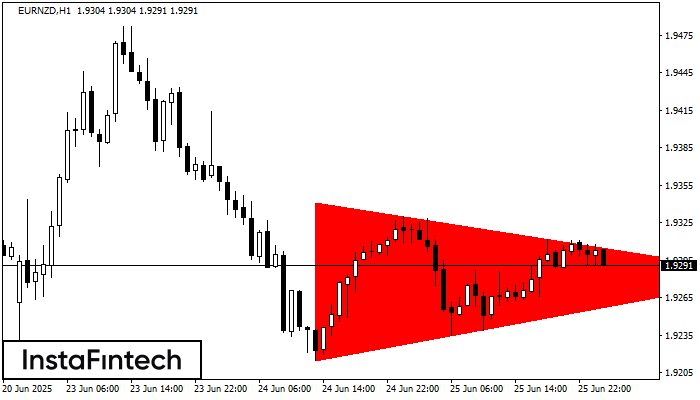
According to the chart of H1, EURNZD formed the Bearish Symmetrical Triangle pattern. This pattern signals a further downward trend in case the lower border 1.9215 is breached. Here
Открыть график инструмента в новом окне


