

signal strength 2 of 5

The Triple Bottom pattern has been formed on EURNZD M15. It has the following characteristics: resistance level 1.9498/1.9463; support level 1.9409/1.9402; the width is 89 points. In the event of a breakdown of the resistance level of 1.9498, the price is likely to continue an upward movement at least to 1.9412.
The M5 and M15 time frames may have more false entry points.
Vea asimismo
- All
- Double Top
- Flag
- Head and Shoulders
- Pennant
- Rectangle
- Triangle
- Triple top
- All
- #AAPL
- #AMZN
- #Bitcoin
- #EBAY
- #FB
- #GOOG
- #INTC
- #KO
- #MA
- #MCD
- #MSFT
- #NTDOY
- #PEP
- #TSLA
- #TWTR
- AUDCAD
- AUDCHF
- AUDJPY
- AUDUSD
- EURCAD
- EURCHF
- EURGBP
- EURJPY
- EURNZD
- EURRUB
- EURUSD
- GBPAUD
- GBPCHF
- GBPJPY
- GBPUSD
- GOLD
- NZDCAD
- NZDCHF
- NZDJPY
- NZDUSD
- SILVER
- USDCAD
- USDCHF
- USDJPY
- USDRUB
- All
- M5
- M15
- M30
- H1
- D1
- All
- Buy
- Sale
- All
- 1
- 2
- 3
- 4
- 5
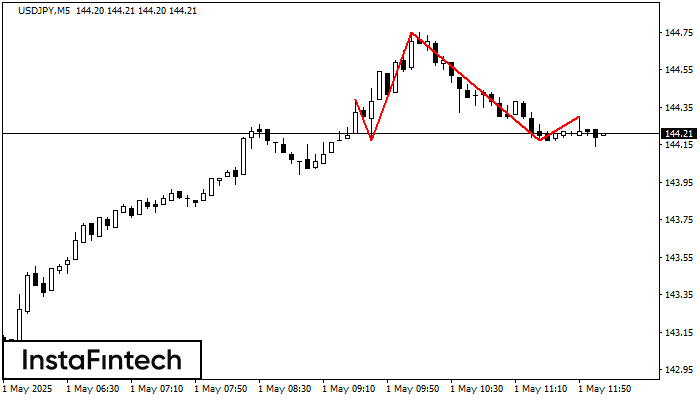
Según el gráfico de M5, USDJPY formó el patrón. El techo de la Cabeza está establecido en 144.75 mientras la línea media del Cuello se encuentra en 144.17/144.17. La formación
Los marcos de tiempo M5 y M15 pueden tener más puntos de entrada falsos.
Open chart in a new window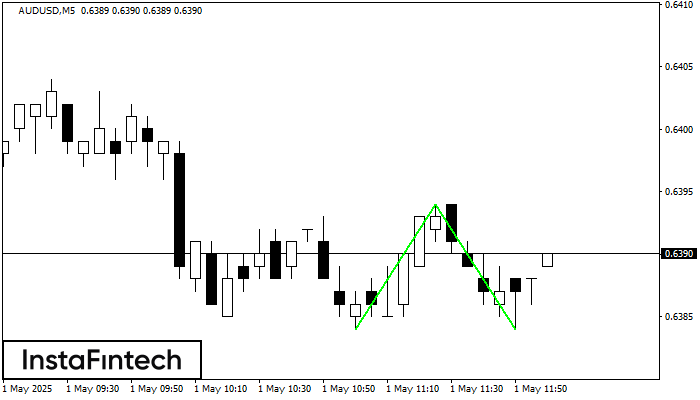
El patrón Doble Piso ha sido formado en AUDUSD M5; el límite superior es 0.6394; el límite inferior es 0.6384. El ancho del patrón es 10 puntos. En caso
Los marcos de tiempo M5 y M15 pueden tener más puntos de entrada falsos.
Open chart in a new window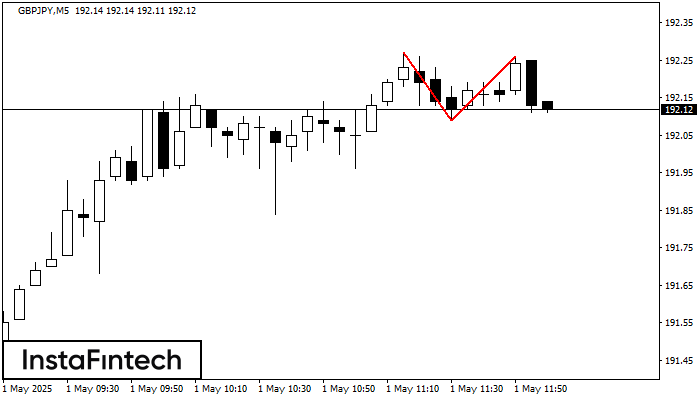
En el gráfico de GBPJPY M5 el patrón de reversión Doble Techo ha sido formado. Características: límite superior 192.26; límite inferior 192.09; el ancho del patrón 17 puntos. La señal
Los marcos de tiempo M5 y M15 pueden tener más puntos de entrada falsos.
Open chart in a new window


