

signal strength 4 of 5
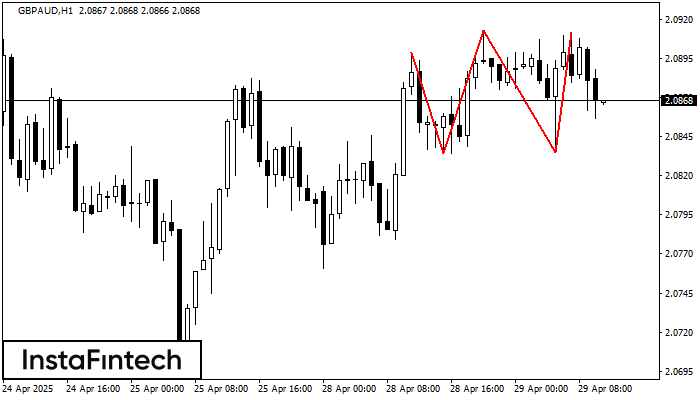
The Triple Top pattern has formed on the chart of the GBPAUD H1 trading instrument. It is a reversal pattern featuring the following characteristics: resistance level -13, support level -1, and pattern’s width 65. Forecast If the price breaks through the support level 2.0834, it is likely to move further down to 2.0873.
- All
- Double Top
- Flag
- Head and Shoulders
- Pennant
- Rectangle
- Triangle
- Triple top
- All
- #AAPL
- #AMZN
- #Bitcoin
- #EBAY
- #FB
- #GOOG
- #INTC
- #KO
- #MA
- #MCD
- #MSFT
- #NTDOY
- #PEP
- #TSLA
- #TWTR
- AUDCAD
- AUDCHF
- AUDJPY
- AUDUSD
- EURCAD
- EURCHF
- EURGBP
- EURJPY
- EURNZD
- EURRUB
- EURUSD
- GBPAUD
- GBPCHF
- GBPJPY
- GBPUSD
- GOLD
- NZDCAD
- NZDCHF
- NZDJPY
- NZDUSD
- SILVER
- USDCAD
- USDCHF
- USDJPY
- USDRUB
- All
- M5
- M15
- M30
- H1
- D1
- All
- Buy
- Sale
- All
- 1
- 2
- 3
- 4
- 5

Según el gráfico de M15, #Bitcoin formó el patrón Triángulo Simétrico Alcista, que señala que la tendencia continuará. Descripción. El límite superior del patrón toca las coordenadas 109440.14/108872.57 donde
Los marcos de tiempo M5 y M15 pueden tener más puntos de entrada falsos.
Open chart in a new window
Según el gráfico de M5, EURNZD formó el Rectángulo Bajista. El patrón indica la continuación de una tendencia. El límite superior es 1.8982, el límite inferior es 1.8964. La señal
Los marcos de tiempo M5 y M15 pueden tener más puntos de entrada falsos.
Open chart in a new window
Según el gráfico de M5, AUDCHF formó el patrón Triángulo Simétrico Alcista. Descripción: Este es el patrón de la continuación de una tendencia. 0.5335 y 0.5329 son las coordenadas
Los marcos de tiempo M5 y M15 pueden tener más puntos de entrada falsos.
Open chart in a new window


