


signal strength 3 of 5
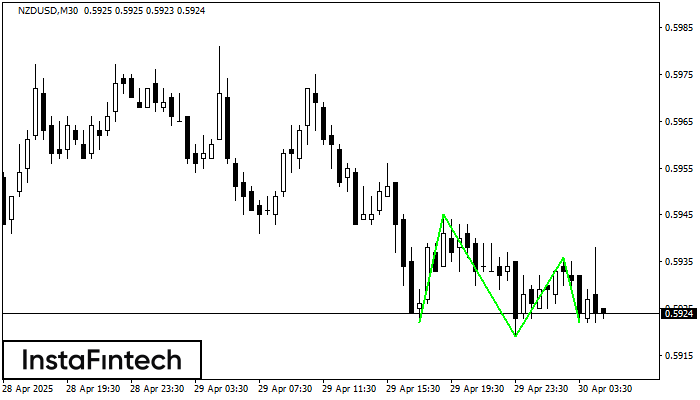
The Triple Bottom pattern has been formed on NZDUSD M30. It has the following characteristics: resistance level 0.5945/0.5936; support level 0.5922/0.5922; the width is 23 points. In the event of a breakdown of the resistance level of 0.5945, the price is likely to continue an upward movement at least to 0.5949.
- All
- Double Top
- Flag
- Head and Shoulders
- Pennant
- Rectangle
- Triangle
- Triple top
- All
- #AAPL
- #AMZN
- #Bitcoin
- #EBAY
- #FB
- #GOOG
- #INTC
- #KO
- #MA
- #MCD
- #MSFT
- #NTDOY
- #PEP
- #TSLA
- #TWTR
- AUDCAD
- AUDCHF
- AUDJPY
- AUDUSD
- EURCAD
- EURCHF
- EURGBP
- EURJPY
- EURNZD
- EURRUB
- EURUSD
- GBPAUD
- GBPCHF
- GBPJPY
- GBPUSD
- GOLD
- NZDCAD
- NZDCHF
- NZDJPY
- NZDUSD
- SILVER
- USDCAD
- USDCHF
- USDJPY
- USDRUB
- All
- M5
- M15
- M30
- H1
- D1
- All
- Buy
- Sale
- All
- 1
- 2
- 3
- 4
- 5
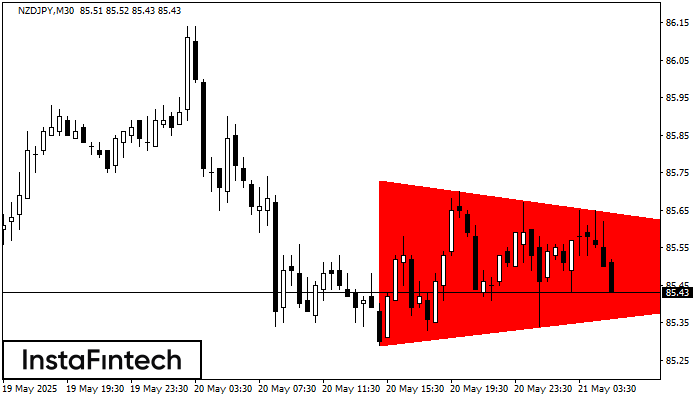
Según el gráfico de M30, el NZDJPY formó el patrón Triángulo Simétrico Bajista. Descripción: El límite inferior es 85.29/85.49 y el límite superior es 85.73/85.49. El ancho del patrón
Open chart in a new window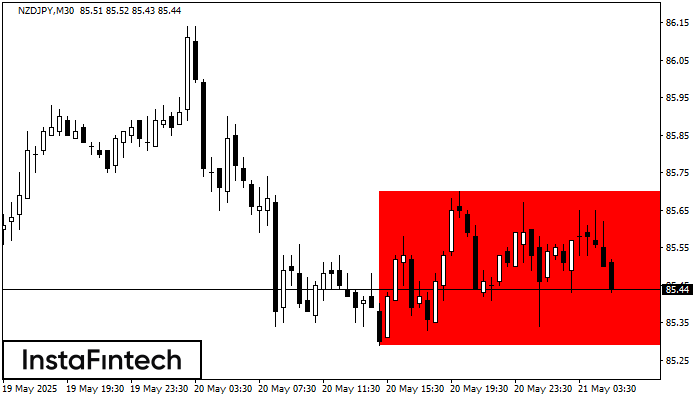
Según el gráfico de M30, NZDJPY formó el Rectángulo Bajista. Este tipo de patrón indica la continuación de una tendencia. Esto consiste de dos niveles: resistencia 85.70 - 0.00
Open chart in a new window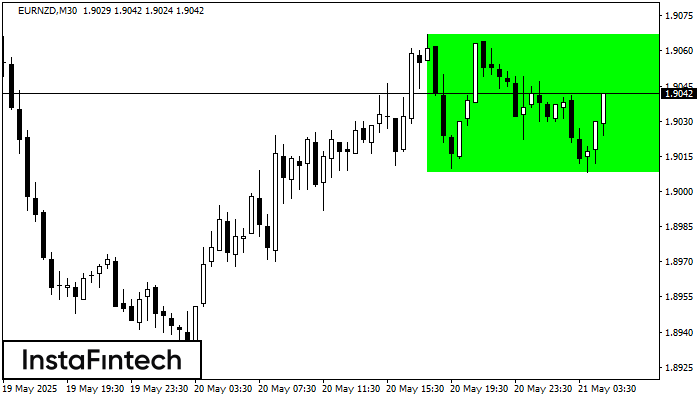
Según el gráfico de M30, EURNZD formó el Rectángulo Alcista que es un patrón de la continuación de una tendencia. El patrón está contenido dentro de los siguientes límites
Open chart in a new window


