empty
08.02.2023 08:17 PM
Technical analysis of EUR/USD for February 08, 2023

This image is no longer relevant

Overview:

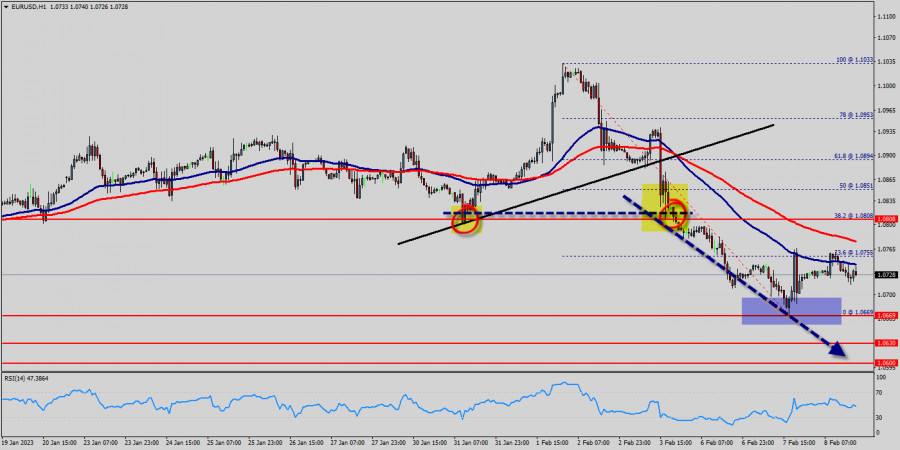
The EUR/USD pair has faced strong resistances at the levels of 1.0880 because support had become resistance last week. So, the strong resistance has been already formed at the level of 1.0880 and the pair is likely to try to approach it in order to test it again. However, if the pair fails to pass through the level of 1.0880, the market will indicate a bearish opportunity below the new strong resistance level of 1.0880 (the level of 1.0880 coincides with a ratio of 38.2% Fibonacci - last bullish wave - double top).

Moreover, the RSI starts signaling a downward trend, as the trend is still showing strength above the moving average (100) and (50). The trend of EUR/USD pair movement was controversial as it took place in the downtrend channel.

Due to the previous events, the price is still set between the levels of 1.0808 and 1.0669, so it is recommended to be careful while making deals in these levels because the prices of 1.0808 and 1.0669 are representing the resistance and support respectively.

Therefore, it is necessary to wait till the downtrend channel is passed through. Then the market will probably show the signs of a bearish market.

It should be noted that the volatility is very high for that the price of the EUR/USD pair is still trading between the prices of 1.0669 and 1.0808 in the coming hours.

Furthermore, the price has been set below the strong resistance at the levels of 1.0808 and 1.0851 which coincide with the 38.2% and 50% Fibonacci retracement levels respectively.

Thus, the market is indicating a bearish opportunity below 1.0808 so it will be good to sell at 1.0808 with the first target of 1.0669.

It will also call for a downtrend in order to continue towards 1.0630. The daily strong support is seen at 1.0600.

However, the stop loss should always be taken into account, for that it will be reasonable to set your stop loss at the level of 1.0851.

Moving averages, in the meantime, maintain their bearish slope way above the current level. Furthermore, although the news is bearish for the EUR/USD pair, professional may not want to sell weakness, but rather following a rebound rally.

Additionally, some aggressive counter-trend buyers may be defending parity. In case a continuousion takes place and the EUR/USD pair breaks through the support level of 1.0669 , a further decline to 1.0600 can occur which would indicate a bearish market.

Signal :

It should be noted that the 1.0808 price will act as a major resistance on Feb. 08th, 2023. Therefore, it will be too gainful to sell short below 1.0808 and look for further downside with 1.0669, 1.0630 and 1.0600 targets. It should also be reminded that stop loss must never exceed the maximum exposure amounts. Thus, stop loss should be placed at the 1.0851 level today.

เลือกช่วงเวลา
5
นาที
15
นาที
30
นาที
1
ชั่วโมง
4
ชั่วโมง
1
วัน
1
สัปดาห์
รับผลกำไรจากการเปลี่ยนแปลงอัตราสกุลเงินดิจิทัลกับ InstaForex.
ดาวน์โหลด MetaTrader 4 และเปิดการซื้อขายครั้งแรกของคุณ.
AUD/USD: ดอลลาร์ออสเตรเลียกลับมาในเกมอีกครั้ง ค่าเงินดอลลาร์ออสเตรเลียกลับมาที่ระดับ 0.65 เมื่อเทียบกับดอลลาร์สหรัฐฯ ท่ามกลางความตึงเครียดทางภูมิศาสตร์ที่ผ่อนคลายลง และความสนใจในสินทรัพย์ที่มีความเสี่ยงที่ฟื้นกลับมา การประกาศหยุดยิงในตะวันออกกลางอาจอยู่ในสถานการณ์ที่ "แขวนอยู่บนเส้นด้าย" แต่เมื่อพิจารณาจากแนวโน้มการปรับขึ้นของ AUD/USD ตลาดดูเหมือนจะมีความมั่นใจว่าทุกฝ่ายจะยึดตามข้อตกลงที่ได้ตกลงกันไว้ การตอบสนองต่อปัจจัยพื้นฐานที่ดีขึ้น ดอลลาร์ออสเตรเลียกำลังมุ่งเป้าไปที่ระดับแนวต้านถัดไปที่ 0.6550 ซึ่งบังเอิญอยู่ที่เส้นบนสุดของตัวบ่งชี้ Bollinger
  • Grand Choice
    Contest by
    InstaForex
    InstaForex always strives to help you
    fulfill your biggest dreams.
    เข้าร่วมการแข่งขัน


บทความแนะนำ

XAU/USD. การวิเคราะห์และพยากรณ์ สถานการณ์ตลาดปัจจุบัน

จากมุมมองทางเทคนิค ราคาทองคำในกราฟ 4 ชั่วโมงได้ปรากฏการยอมรับต่ำกว่าเส้นค่าเฉลี่ยเคลื่อนที่อย่างง่าย (SMA) 100 ช่วง ซึ่งเป็นสัญญาณที่บ่งบอกถึงความเป็นไปได้ที่จะมีการลดลงต่อเนื่อง นอกจากนี้ ออสซิลเลเตอร์ในกราฟเดียวกันยังแสดงทิศทางลบ แม้ว่าจะอยู่ในระดับขายมากเกินไป ซึ่งบ่งชี้ถึงการฟื้นตัวได้ระหว่างวัน การกดดันขายที่ต่ำกว่าระดับแนวรับที่ $3325 จะยืนยันความเป็นไปได้ที่จะดิ่งลงต่อ

Irina Yanina 18:27 2025-06-24 UTC+2

สัญญาณการเทรดสำหรับทองคำ (XAU/USD) ระหว่างวันที่ 24-28 มิถุนายน 2025: ขายต่ำกว่า $3,327 (21 SMA - 200 EMA)

ในช่วงต้นของการซื้อขายในตลาดสหรัฐฯ ทองคำอยู่ที่ประมาณ 3,300 ซึ่งต่ำกว่าค่าเฉลี่ยเคลื่อนที่อย่างง่าย 21 วัน และต่ำกว่าค่าเฉลี่ยเคลื่อนที่เอ็กซ์โปเนนเชียล 200 วัน เราเห็นการปรับฐานทางเทคนิคที่แข็งแกร่งลงมาต่ำกว่า 3,390 ในช่วงไม่กี่ชั่วโมงที่ผ่านมา และการฟื้นตัวทางเทคนิคที่ระดับราคาปัจจุบันถือว่าเป็นไปได้ บริเวณ 3,300

Dimitrios Zappas 18:05 2025-06-24 UTC+2

สัญญาณการเทรดสำหรับ EUR/USD ระหว่างวันที่ 24-28 มิถุนายน 2025: ขายเมื่อราคาต่ำกว่า 1.1620 (ทริปเปิลท็อป - 8/8 มาร์รีย์)

กราฟ H4 แสดงรูปแบบ triple-top formation หากราคาของยูโรลดลงต่ำกว่า 1.1620 สัญญาณจะเป็นลบ และเราสามารถขายด้วยเป้าหมายที่ 1.1533 ยิ่งไปกว่านั้น EUR/USD อาจไปถึงระดับ Murray 6/8

Dimitrios Zappas 18:04 2025-06-24 UTC+2

พยากรณ์ Forex วันที่ 24/06/2025: EUR/USD, USD/JPY, USDX, GBP/USD, น้ำมัน และ Bitcoin

ลิงก์ที่เป็นประโยชน์: บทความอื่นๆ ของฉันสามารถเข้าถึงได้ในหมวดนี้ คอร์ส InstaForex สำหรับผู้เริ่มต้น การวิเคราะห์ยอดนิยม เปิดบัญชีซื้อขาย สำคัญ: ผู้เริ่มต้นในการเทรดฟอเร็กซ์ต้องระมัดระวังอย่างมากในการตัดสินใจเข้าสู่ตลาด ก่อนการรายงานที่สำคัญ การอยู่ห่างจากตลาดเป็นวิธีที่ดีที่สุด เพื่อหลีกเลี่ยงความผันผวนของตลาดที่เกิดขึ้นรุนแรงจากความผันผวนที่เพิ่มขึ้น หากคุณตัดสินใจที่จะเทรดในช่วงที่มีการประกาศข่าว ควรสั่งวาง

Sebastian Seliga 12:35 2025-06-24 UTC+2

การพยากรณ์สำหรับ EUR/USD วันที่ 24 มิถุนายน 2025

ในวันจันทร์ คู่เงิน EUR/USD ในกราฟรายชั่วโมงได้มีการดีดตัวขึ้นสองครั้งจากระดับ Fibonacci retracement 76.4% ที่ 1.1454 กลับตัวในทิศทางที่เป็นบวกสำหรับยูโร และปรับตัวสูงขึ้นไปถึงระดับ Fibonacci 100.0% ที่ 1.1574

Samir Klishi 10:48 2025-06-24 UTC+2

การคาดการณ์สำหรับ GBP/USD ในวันที่ 24 มิถุนายน 2025

ในกราฟรายชั่วโมง คู่สกุลเงิน GBP/USD ในวันจันทร์ได้ฟื้นตัวจากเขตแนวรับ 1.3357–1.3373 เปลี่ยนทิศทางในทางที่เป็นบวกกับเงินปอนด์อังกฤษ และยืนอยู่เหนือเขต 1.3425–1.3444 รวมทั้งระดับ Fibonacci retracement ที่ 127.2% ที่ 1.3527

Samir Klishi 10:44 2025-06-24 UTC+2

การปรับฐานอ่อนตัวของทองคำสามารถทำให้ราคาลงไปถึงระดับ 3320 ได้หรือไม่, วันอังคารที่ 24 มิถุนายน 2025

1. สรุปความรู้สึกของตลาด: หลังจากที่ราคาทองคำเพิ่มขึ้นอย่างมีนัยสำคัญเมื่อวานนี้ เช้านี้ราคาทองคำได้ประสบกับการปรับฐานลงถึง -0.39% ซึ่งการปรับฐานนี้เกิดจากผลกระทบของสถานการณ์ภูมิรัฐศาสตร์ในปัจจุบันและพลวัตของตลาดเงินที่เกิดขึ้น ในเชิงเทคนิคเมื่อวานมีสัญญาณ Divergence ระหว่างการเคลื่อนไหวของราคาทองคำและยังอยู่ในสภาวะ Overbought จึงเป็นธรรมชาติที่เกิดการปรับฐานในวันนี้ 2. การวิเคราะห์ทางเทคนิค: 2.1. สภาพคล่องในตลาด

Arief Makmur 10:43 2025-06-24 UTC+2

การพยากรณ์ EUR/USD สำหรับวันที่ 24 มิถุนายน 2025

เมื่อวันจันทร์ที่ผ่านมา ยูโรสามารถทะลุเส้นความต้านทานเชิงเส้นที่ 1.1535 และเส้น MACD ได้สำเร็จ ตั้งแต่การเปิดตลาดในแปซิฟิก ราคาได้เพิ่มขึ้นอย่างต่อเนื่องสู่ระดับเป้าหมายที่ 1.1692 การทะลุแนวต้านนี้ขึ้นไปอาจขยายการเคลื่อนไหวในทิศทางขึ้นไปยังเส้นกรอบราคาใกล้ระดับ 1.1820 บนกราฟ H4 ราคาทะลุแนวต้านที่มีอยู่ทั้งหมดได้อย่างแรง ในขณะที่ออสซิลเลเตอร์

Laurie Bailey 04:51 2025-06-24 UTC+2

การพยากรณ์ GBP/USD สำหรับวันที่ 24 มิถุนายน 2025

GBP/USD สกุลเงินปอนด์อังกฤษกำลังอยู่ในช่วงบวก โดยสามารถหักล้างแรงกดดันจากฝั่งที่คาดหวังให้ลดลงสู่เป้าหมายที่ 1.3208 ได้อย่างหนักแน่น อย่างไรก็ตาม ณ ขณะนี้ เส้น MACD ที่ระดับ 1.3570 กำลังใกล้จะโดนทำลาย หากระดับนี้ถูกทำลาย ผู้ซื้อจะมุ่งความสนใจไปที่แนวต้านเป้าหมายสำคัญที่

Laurie Bailey 04:47 2025-06-24 UTC+2

การคาดการณ์ USD/JPY สำหรับวันที่ 24 มิถุนายน 2025

USD/JPY ภาพทางเทคนิคเมื่อวันจันทร์อาจส่งผลต่อการพัฒนาในอนาคตในระยะกลาง สัปดาห์เริ่มต้นด้วยช่องว่างขาขึ้น ตามมาด้วยการเกิดเงาบนยาว การปิดรายวันเกิดขึ้นที่ระดับแนวรับ 146.11 ซึ่งทำให้ช่องว่างถูกปิดไป การซื้อขายในวันนี้เปิดที่ระดับเดียวกันทุกประการ และแท่งเทียนก็เริ่มเป็นสีดำตั้งแต่ช่วงแรกของการซื้อขาย ซึ่งกำหนดการเคลื่อนไหวของวันจันทร์ว่าเป็นเทียม ทำให้เกิดสัญญาณขายที่แข็งแกร่ง โดยมีโอกาสที่ราคาจะทะลุแนวรับที่ 143.45 และลดลงต่อไปสู่เส้น MACD

Laurie Bailey 04:44 2025-06-24 UTC+2
หากไม่สะดวกคุยในตอนนี้
ระบุคำถามไว้ได้ใน แชท.
Widget callback
 

Dear visitor,

Your IP address shows that you are currently located in the USA. If you are a resident of the United States, you are prohibited from using the services of InstaFintech Group including online trading, online transfers, deposit/withdrawal of funds, etc.

If you think you are seeing this message by mistake and your location is not the US, kindly proceed to the website. Otherwise, you must leave the website in order to comply with government restrictions.

Why does your IP address show your location as the USA?

  • - you are using a VPN provided by a hosting company based in the United States;
  • - your IP does not have proper WHOIS records;
  • - an error occurred in the WHOIS geolocation database.

Please confirm whether you are a US resident or not by clicking the relevant button below. If you choose the wrong option, being a US resident, you will not be able to open an account with InstaForex anyway.

We are sorry for any inconvenience caused by this message.