empty
20.03.2023 02:04 PM
Technical analysis of GBP/USD for March 20, 2023

This image is no longer relevant

Overview :

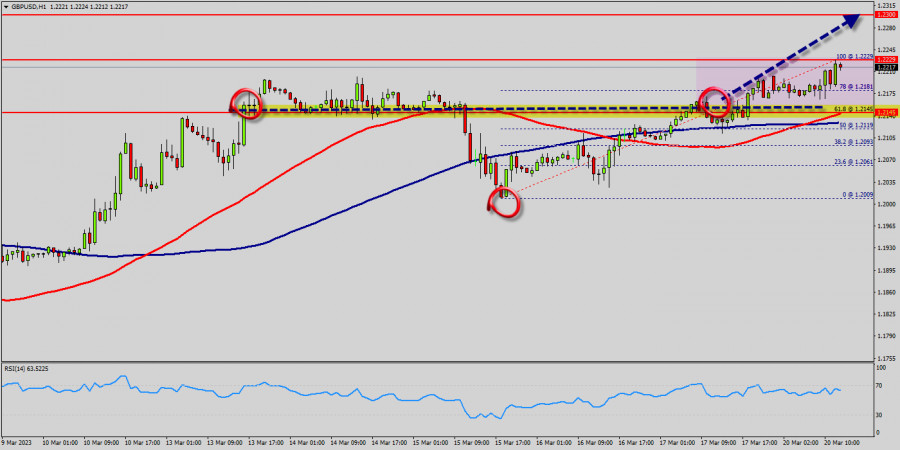
The GBP/USD pair traded higher and closed the day in the positive territory near the price of 1.2208. Right now, it was trading in a narrow range of 1.2150 staying close to a 2-days high. On the hourly chart, the GBP/USD pair is still trading above the MA (100) H1 moving average line (1.2068 - weekly pivot point). The situation is similar on the 4-hour chart. Based on the foregoing, it is probably worth sticking to the north direction in trading, and as long as the GBP/USD pair remains above MA 100 H1, it may be necessary to look for entry points to buy for the formation of a correction.

All elements being clearly bullish, it would be possible for traders to trade only long positions on the GBP/USD pair as long as the price remains well above the golden ratio of 1.2068. The buyers' bullish objective is set at 1.2209.

The price is likely to form a double top in the same time frame. Accordingly, the GBP/USD pair is showing signs of strength following a breakout of the highest level of 1.2209. So, buy above the level of 1.2068 with the first target at 1.2209 in order to test the daily resistance 1. The level of 1.2209 is a good place to take profits.

Moreover, the RSI is still signaling that the trend is upward as it remains strong above the moving average (100). This suggests that the pair will probably go up in coming hours. A bullish break in this resistance would boost the bullish momentum. Other outlook for the GBP/USD pair : Pound Sterling is currently trading at 1.2150. If the trend reverses from this point, then a possible future share price target could be 1.2209.

If the price of Pound Sterling is trading above 1.2150 then possibility of upside targets getting achieved is higher around the level of 1.2150. The basic bullish trend is very strong on the GBP/USD pair, but the short term shows some signs of running out of steam. Nevertheless, a purchase could be considered as long as the price remains above 1.2150.

Crossing the first resistance at 1.2209 would be a sign of a potential new surge in the price. Buyers would then use the next resistance located at 1.2270 as an objective. Crossing it would then enable buyers to target 1.2270. Caution, a return to below 1.2270 would be a sign of a consolidation phase in the short-term basic trend. If this is the case, remember that trading against the trend may be riskier.

It would seem more appropriate to wait for a signal indicating reversal of the trend. In the very short term, the general bullish sentiment is not called into question, despite technical indicators being indecisive. All elements being clearly bullish market, it would be possible for traders to trade only long positions on the GBP/USD pair as long as the price remains well above the price of 1.2068. The GBP/USD pair will continue rising from the level of 1.2068 in the long term.

It should be noted that the support is established at the level of 1.2068 which represents the last bearish wave. The price is likely to form a double bottom in the same time frame. Accordingly, the GBP/USD pair is showing signs of strength following a breakout of the highest level of 1.2068. So, buy above the level of 1.2068 with the first target at 1.2209 in order to test the daily resistance 1. The buyers' bullish objective is set at the level of 1.2270 (last bullish wave). A bullish break in this resistance would boost the bullish momentum.

The buyers could then target the resistance located at 1.2270 . This suggests that the pair will probably go up in coming hours. If the trend is able to break the level of 1.2209 (double top), then the market will call for a strong bullish market towards the objective of 1.2270 this week. If there is any crossing, the next objective would be the resistance located at 1.2270.

The level of 1.2270 is a good place to take profits. Moreover, the RSI is still signaling that the trend is upward as it remains strong above the moving average (100). Since the trend is above the 61.8% Fibonacci level (1.2068), it means the market is still in a uptrend. From this point, the GBP/USD pair is continuing in a bullish trend from the new support of 1.2068. This is shown to us as the current price is in a bullish channel.

According to the previous events, we expect that the GBP/USD pair will move between 1.2068 and 1.2270 in coming hours. It is also should be noted, beware of bullish excesses that could lead to a possible short-term correction; but this possible correction would not be tradeable.

On the other hand, in case a reversal takes place and the GBP/USD pair breaks through the support level of 1.2068, a further decline to 1.1981 can occur. It would indicate a bearish market.

Summary
Urgency
Analytic
Mourad El Keddani
Start trade
รับผลกำไรจากการเปลี่ยนแปลงอัตราสกุลเงินดิจิทัลกับ InstaForex.
ดาวน์โหลด MetaTrader 4 และเปิดการซื้อขายครั้งแรกของคุณ.
GBP/USD: เคล็ดลับการเทรดง่ายๆ สำหรับนักเทรดมือใหม่ในวันที่ 1 สิงหาคม วิเคราะห์การเทรด Forex ของเมื่อวาน การทดสอบระดับ 1.3237 เกิดขึ้นในขณะที่ตัวบ่งชี้ MACD เพิ่งเริ่มเคลื่อนไหวขึ้นจากเส้นศูนย์ ยืนยันจุดเข้าซื้อปอนด์ที่ถูกต้อง แต่อย่างไรก็ตาม การเคลื่อนไหวก็ไม่เกิดขึ้นจริง ส่งผลให้เกิดการขาดทุน ข้อมูลตลาดแรงงานสหรัฐฯ ที่แข็งแกร่งยังเป็นตัวกระตุ้นให้เกิดคลื่นการขายเงินปอนด์อังกฤษอีกระลอกหนึ่ง ตลาดแรงงานสหรัฐฯ ที่แข็งแกร่งเพิ่มความนิยมนับถือในดอลลาร์มากขึ้น ทำให้มันเป็นสินทรัพย์ที่ปลอดภัยในภาวะความไม่แน่นอนทั่วโลก ธนาคารแห่งประเทศอังกฤษกำลังเผชิญกับภาวะลำบาก
  • Grand Choice
    Contest by
    InstaForex
    InstaForex always strives to help you
    fulfill your biggest dreams.
    เข้าร่วมการแข่งขัน


บทความแนะนำ

สัญญาณการเทรดสำหรับ BITCOIN ระหว่างวันที่ 1-5 สิงหาคม 2025: ซื้อที่ราคาสูงกว่า $115,000 (200 EMA - 5/8 Murray)

เมื่อวานนี้ Bitcoin ได้ถึงแนวต้านที่แข็งแกร่งรอบระดับ 6/8 ของ Murray ที่ 118,900 ในช่วงตลาดอเมริกา BTC ไม่สามารถทะลุผ่านพื้นที่นี้ได้และลดลงอย่างรวดเร็วสู่ระดับต่ำสุดที่ 114,397 Bitcoin ร่วงลงเกือบ $5,000

Dimitrios Zappas 07:50 2025-08-01 UTC+2

สัญญาณการซื้อขายสำหรับทองคำ (XAU/USD) สำหรับวันที่ 1-4 สิงหาคม 2025: ซื้อเหนือ $3,281 (21 SMA - 4/8 Murray)

ทองคำกำลังซื้อขายอยู่ที่ประมาณ 3,292 โดยดีดตัวขึ้นเหนือระดับ 4/8 ของ Murray และกำลังสร้างรูปแบบทางเทคนิคที่เรียกว่า pennant หากราคาทะลุเหนือ 3,396 หรือแม้กระทั่งมีการยืนยันเหนือ 21 SMA อาจเป็นสัญญาณเริ่มต้นของรอบขาขึ้น หากทองคำได้รับการสนับสนุนอย่างแข็งแกร่งบริเวณระดับ

Dimitrios Zappas 07:47 2025-08-01 UTC+2

การคาดการณ์ค่าเงินยูโร/ดอลลาร์สหรัฐ สำหรับวันที่ 1 สิงหาคม 2025

เมื่อวานนี้ ตลาดได้เห็นการถอยห่างจากสินทรัพย์ที่มีความเสี่ยง: ดัชนี S&P 500 ลดลง 0.37%, ดัชนีดอลลาร์สหรัฐเพิ่มขึ้น 0.16% และราคาน้ำมันลดลง 0.90% อัตราผลตอบแทนพันธบัตรรัฐบาลยังคงอยู่ในช่วงของวันจันทร์ โดยมีความสมดุลด้วยการหลีกเลี่ยงความเสี่ยงและการคาดการณ์ถึงอัตราดอกเบี้ยที่สูงอย่างต่อเนื่อง สิ่งที่น่าสังเกตมากขึ้นคือ การเพิ่มขึ้น

Laurie Bailey 04:52 2025-08-01 UTC+2

การคาดการณ์ GBP/USD สำหรับวันที่ 1 สิงหาคม 2025

เมื่อวานนี้ เงินปอนด์อังกฤษเคลื่อนไหวอยู่ภายในช่วงที่คาดไว้ระหว่าง 1.3206–1.3265 และปิดตลาดด้วยแท่งเทียนสีดำ ขณะที่วันนี้เปิดตลาดต่ำกว่าขอบล่างของช่วงดังกล่าว เป้าหมายที่ 1.3090 ตอนนี้จึงเปิดสู่สถานะที่เป็นไปได้ หากข้อมูลการจ้างงานของสหรัฐฯ ในวันนี้ไม่ทำให้ผิดหวัง — โดยคาดว่าจะมีการเพิ่มงานนอกภาคเกษตร 106,000 ตำแหน่งในเดือนกรกฎาคม —

Laurie Bailey 04:50 2025-08-01 UTC+2

การคาดการณ์ EUR/JPY สำหรับวันที่ 1 สิงหาคม 2025

คู่สกุลเงิน EUR/JPY ได้ร่วงลงอย่างชัดเจนจากขอบบนของช่องราคาพร้อมกันกับที่ออสซิลเลเตอร์ Marlin ได้เข้าสู่พื้นที่ลบ (กราฟรายวัน) เมื่อวานนี้ ราคาได้เด้งกลับจากแนวสนับสนุนของเส้นสมดุล ขณะนี้ ราคาดูเหมือนจะเตรียมตัวพยายามครั้งใหม่เพื่อทะลวงผ่านระดับแนวรับที่ 169.30 ซึ่งได้รับการเสริมพลังจากเส้น MACD (ค่าเฉลี่ยเคลื่อนที่สีฟ้า) การหลุดต่ำกว่าแนวรับนี้จะเปิดทางไปยังช่วงเป้าหมาย

Laurie Bailey 04:42 2025-08-01 UTC+2

การพยากรณ์สำหรับ EUR/USD ในวันที่ 31 กรกฎาคม 2025

ในวันพุธ คู่สกุลเงิน EUR/USD ยังคงลดลงอย่างต่อเนื่องหลังจากดีดตัวขึ้นจากระดับการถอนกลับของฟีโบนัชชี่ 100.0% ที่ 1.1574 ณ ตอนท้ายของวัน คู่สกุลปิดต่ำกว่าระดับ 76.4% ที่ 1.1454 ซึ่งเปิดทางสำหรับการลดลงต่อไปสู่โซนสนับสนุนที่ 1.1374–1.1380

Samir Klishi 13:23 2025-07-31 UTC+2

การพยากรณ์ GBP/USD ประจำวันที่ 31 กรกฎาคม 2025

ในกราฟรายชั่วโมง คู่เงิน GBP/USD ปรับตัวขึ้นในวันพุธจากโซนแนวต้านที่ 1.3357–1.3371 และกลับตัวเป็นระดับดอลลาร์สหรัฐ จนทำให้ราคาลดลงต่ำกว่าระดับ Fibonacci retracement 127.2% ที่ 1.3258 การที่ราคาปรับตัวลงคงที่ในวันนี้ต่ำกว่าระดับนี้จะเปิดโอกาสให้ผู้ค้าคาดการณ์ว่าจะปรับตัวลดลงต่อเนื่องไปยังโซนแนวรับถัดไปที่ 1.3114–1.3139 หากราคาสามารถปรับตัวคงที่เหนือ

Samir Klishi 13:21 2025-07-31 UTC+2

GBP/USD. การวิเคราะห์อินดิเคเตอร์วันที่ 31 กรกฎาคม 2025

การวิเคราะห์แนวโน้ม (รูปที่ 1): ในวันพฤหัสบดี จากระดับ 1.3232 (การปิดเทียนรายวันวันพุธ) ตลาดอาจเริ่มเคลื่อนที่ขึ้นไปทางระดับ 14.6% retracement ที่ 1.3279 (เส้นประสีแดง) จากระดับนี้ ราคามีโอกาสปรับตัวลงมาที่

Stefan Doll 13:15 2025-07-31 UTC+2

EUR/USD: การวิเคราะห์โดยใช้ตัวชี้วัดประจำวันที่ 31 กรกฎาคม 2025

วิเคราะห์แนวโน้ม (Fig. 1): ในวันพฤหัสบดี จากระดับ 1.1404 (ราคาปิดของแท่งเทียนวันพุธ) ตลาดอาจเริ่มมีทิศทางขึ้นสู่ระดับการปรับฐาน 14.6% ที่ 1.1456 (เส้นประสีเหลือง) เมื่อถึงระดับนี้ ราคาอาจจะถอยลงไปยังระดับเป้าหมาย 161.8%

Stefan Doll 13:09 2025-07-31 UTC+2

พยากรณ์ Forex วันที่ 31/07/2025: EUR/USD, USD/JPY, GBP/USD, SP500, Ethereum และ Bitcoin

ลิงก์ที่มีประโยชน์: บทความอื่น ๆ ของฉันสามารถอ่านได้ในส่วนนี้ หลักสูตร InstaForex สำหรับผู้เริ่มต้น การวิเคราะห์ที่ได้รับความนิยม เปิดบัญชีซื้อขาย สำคัญ: ผู้เริ่มต้นในตลาดแลกเปลี่ยนเงินตราต่างประเทศจำเป็นต้องระมัดระวังอย่างมากเมื่อทำการตัดสินใจเข้าสู่ตลาด ก่อนที่รายงานสำคัญๆ จะถูกเปิดเผย ควรหลีกเลี่ยงการเข้าเทรดในตลาดเพื่อป้องกันความเสี่ยงจากความผันผวนที่รุนแรง หากคุณตัดสินใจที่จะเทรดในช่วงที่ข่าวถูกประกาศแล้ว

Sebastian Seliga 10:02 2025-07-31 UTC+2
หากไม่สะดวกคุยในตอนนี้
ระบุคำถามไว้ได้ใน แชท.
Widget callback
 

Dear visitor,

Your IP address shows that you are currently located in the USA. If you are a resident of the United States, you are prohibited from using the services of InstaFintech Group including online trading, online transfers, deposit/withdrawal of funds, etc.

If you think you are seeing this message by mistake and your location is not the US, kindly proceed to the website. Otherwise, you must leave the website in order to comply with government restrictions.

Why does your IP address show your location as the USA?

  • - you are using a VPN provided by a hosting company based in the United States;
  • - your IP does not have proper WHOIS records;
  • - an error occurred in the WHOIS geolocation database.

Please confirm whether you are a US resident or not by clicking the relevant button below. If you choose the wrong option, being a US resident, you will not be able to open an account with InstaForex anyway.

We are sorry for any inconvenience caused by this message.