empty
07.04.2023 12:06 AM
Technical analysis of EUR/USD for April 06, 2023

This image is no longer relevant

Overview :

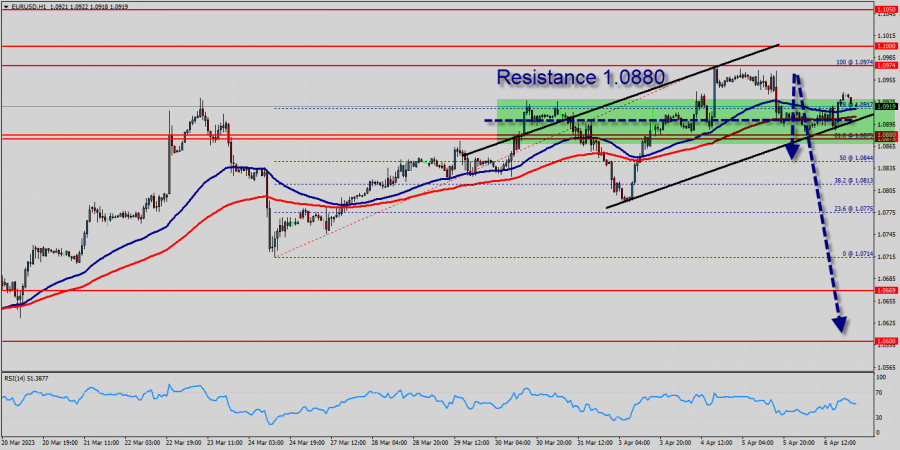
Since last week, the EUR/USD pair has faced strong resistances at the levels of 1.0880 because support had become resistance last week. So, the strong resistance has been already formed at the level of 1.0880 and the pair is likely to try to approach it in order to test it again. However, if the pair fails to pass through the level of 1.0880, the market will indicate a bearish opportunity below the new strong resistance level of 1.0880 (the level of 1.0880 coincides with a ratio of 61.8% Fibonacci - last bullish wave - double top).

Moreover, the RSI starts signaling a downward trend, as the trend is still showing strength above the moving average (100) and (50). The trend of EUR/USD pair movement was controversial as it took place in the downtrend channel. Due to the previous events, the price is still set between the levels of 1.0808 and 1.0669, so it is recommended to be careful while making deals in these levels because the prices of 1.0808 and 1.0669 are representing the resistance and support respectively.

It is necessary to wait till the downtrend channel is passed through. Then the market will probably show the signs of a bearish market. It should be noted that the volatility is very high for that the price of the EUR/USD pair is still trading between the prices of 1.0669 and 1.0808 in the coming hours. Furthermore, the price has been set below the strong resistance at the levels of 1.0808 and 1.0851 which coincide with the ratios of Fibonacci retracement levels respectively. Thus, the market is indicating a bearish opportunity below 1.0880 so it will be good to sell at 1.0808 with the first target of 1.0669.

It will also call for a downtrend in order to continue towards 1.0630. The daily strong support is seen at 1.0600. However, the stop loss should always be taken into account, for that it will be reasonable to set your stop loss at the level of 1.0851. Moving averages, in the meantime, maintain their bearish slope way above the current level.

Furthermore, although the news is bearish for the EUR/USD pair, professional may not want to sell weakness, but rather following a rebound rally. Additionally, some aggressive counter-trend buyers may be defending parity. In case a continuisions takes place and the EUR/USD pair breaks through the support level of 1.0669, a further decline to 1.0600 can occur which would indicate a bearish market.

The EUR/USD pair didn't make any significant movements yesterday. There are no changes in our technical outlook. The bias remains bearish in the nearest term testing 1.0669 or lower. Immediate support is seen around 1.0669. A clear break below that area could lead price to the neutral zone in the nearest term. Price will test 1.06030, because in general, we remain bearish on between Feb 13rd and Feb 18th, 2023. The market moved from its bottom at 1.0669 and continued to rise towards the top of 1.0680. Today, on the one-hour chart, the current rise will remain within a framework of correction.

This image is no longer relevant

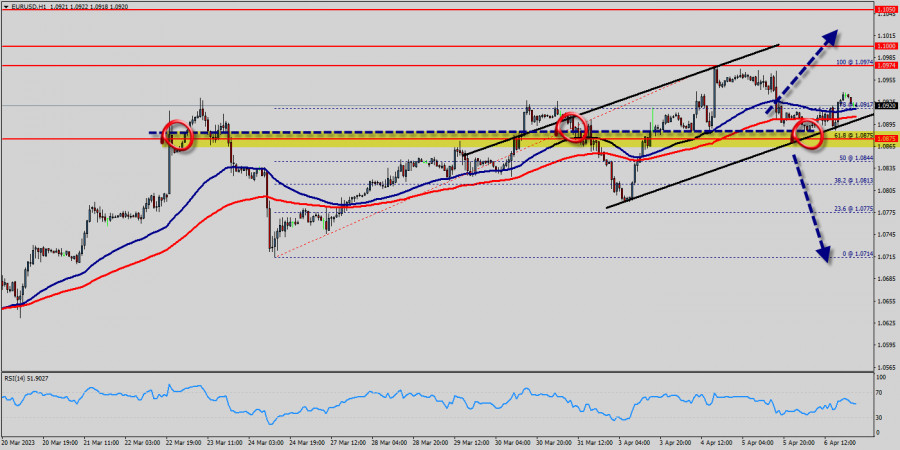
However, if the pair fails to pass through the level of 1.0732 (major resistance), the market will indicate a bearish opportunity below the strong resistance level of 1.0669 (the level of 1.0669 coincides with the ratio of 00% Fibonacci retracement - last bearish wave). This resistance has been rejected several times confirming the downtrend. Additionally, the RSI starts signaling a downward trend.

The trend is still below the 100 EMA for that the bearish outlook remains the same as long as the 100 EMA is headed to the downside. Since there is nothing new in this market, it is not bullish yet. Sell deals are recommended below the level of 1.0669 with the first target at 1.0630 so as to test the double bottom. If the trend breaks the double bottom level of 1.0600, the pair is likely to move downwards continuing the development of a bearish trend to the level of 1.0600 in order to test the weekly support 2. The third weekly support is set at the price of 1.0543.

Summary
Urgency
Analytic
Mourad El Keddani
Start trade
รับผลกำไรจากการเปลี่ยนแปลงอัตราสกุลเงินดิจิทัลกับ InstaForex.
ดาวน์โหลด MetaTrader 4 และเปิดการซื้อขายครั้งแรกของคุณ.
  • Grand Choice
    Contest by
    InstaForex
    InstaForex always strives to help you
    fulfill your biggest dreams.
    เข้าร่วมการแข่งขัน


บทความแนะนำ

การทำนายค่าเงิน Forex 01/08/2025: EUR/USD, USD/JPY, GBP/USD, ทองคำ และ Bitcoin

ลิงก์ที่เป็นประโยชน์: บทความอื่น ๆ ของฉันมีอยู่ในส่วนนี้ หลักสูตร InstaForex สำหรับผู้เริ่มต้น การวิเคราะห์ยอดนิยม เปิดบัญชีซื้อขาย สำคัญ: ผู้เริ่มต้นในตลาดฟอเร็กซ์ควรระมัดระวังอย่างมากเมื่อทำการตัดสินใจในการเข้าตลาด ก่อนที่มีการเปิดเผยรายงานสำคัญ ควรหลีกเลี่ยงการเข้าตลาดเพื่อป้องกันไม่ให้เจอกับความผันผวนของตลาดที่รุนแรงอันเนื่องมาจากความผันผวนที่เพิ่มขึ้น หากคุณตัดสินใจทำการซื้อขายในช่วงที่มีการเผยแพร่ข่าว ก็ควรตั้งคำสั่งหยุดการขาดทุนเพื่อจำกัดการสูญเสียไว้เสมอ

Sebastian Seliga 12:24 2025-08-01 UTC+2

การคาดการณ์สำหรับ EUR/USD ในวันที่ 1 สิงหาคม 2025

เมื่อวันพฤหัสบดี คู่เงิน EUR/USD ได้เคลื่อนกลับไปยังระดับการย้อนกลับ Fibonacci ที่ 76.4% ที่ 1.1454 หลังจากนั้นมีการดีดกลับจากระดับดังกล่าว และกลับทิศทางในเชิงสนับสนุนให้กับดอลลาร์สหรัฐ อย่างไรก็ตาม ตลาดหมีไม่สามารถรักษาโมเมนตัมขาลงไว้ได้ การดีดกลับอีกครั้งจากระดับ 1.1454

Samir Klishi 11:27 2025-08-01 UTC+2

การคาดการณ์สำหรับ GBP/USD ในวันที่ 1 สิงหาคม 2025

ในกราฟรายชั่วโมง คู่เงิน GBP/USD ในวันพฤหัสบดีปรับตัวต่ำกว่าระดับการสะท้อนกลับ 127.2% ที่ 1.3258 ซึ่งบ่งบอกถึงความเป็นไปได้ในการปรับตัวลงต่อเนื่องไปยังโซนแนวรับที่ 1.3114–1.3139 การดีดกลับจากโซน 1.3114–1.3139 หรือการฝ่าแนวต้านขึ้นไปเหนือ 1.3259 จะเป็นประโยชน์ต่อเงินปอนด์และอาจทำให้มีโอกาสขึ้นไปที่โซนแนวต้านที่ 1.3357–1.3371

Samir Klishi 11:11 2025-08-01 UTC+2

GBP/USD: การวิเคราะห์ดัชนีและภาพรวมรายวันประจำวันที่ 1 สิงหาคม 2025

การวิเคราะห์แนวโน้ม (รูปที่ 1) ในวันศุกร์ เริ่มที่ระดับ 1.3203 (ระดับปิดของแท่งเทียนเมื่อวานนี้) ตลาดอาจเคลื่อนตัวลงต่อไปยังเป้าหมายที่ 1.3172 ซึ่งเป็นระดับเป้าหมายที่ 185.4% (เส้นประสีน้ำเงิน) เมื่อทดสอบระดับนี้แล้ว อาจมีการปรับตัวขึ้นอีกครั้ง โดยมีเป้าหมายที่

Stefan Doll 10:37 2025-08-01 UTC+2

EUR/USD: การวิเคราะห์อินดิเคเตอร์และภาพรวมรายวันประจำวันที่ 1 สิงหาคม 2025

การวิเคราะห์แนวโน้ม (รูปที่ 1) ในวันศุกร์ จากระดับ 1.1414 (ซึ่งเป็นจุดปิดของเทียนรายวันเมื่อวานนี้) ตลาดอาจเคลื่อนตัวขึ้นไปยังเป้าหมายที่ 1.1456 ซึ่งเป็นระดับการปรับตัวกลับที่ 14.6% (เส้นประสีเหลือง) เมื่อทดสอบระดับนี้แล้ว อาจมีการเคลื่อนตัวขึ้นไปสู่เป้าหมายที่ 1.1492

Stefan Doll 09:48 2025-08-01 UTC+2

สัญญาณการเทรดสำหรับ BITCOIN ระหว่างวันที่ 1-5 สิงหาคม 2025: ซื้อที่ราคาสูงกว่า $115,000 (200 EMA - 5/8 Murray)

เมื่อวานนี้ Bitcoin ได้ถึงแนวต้านที่แข็งแกร่งรอบระดับ 6/8 ของ Murray ที่ 118,900 ในช่วงตลาดอเมริกา BTC ไม่สามารถทะลุผ่านพื้นที่นี้ได้และลดลงอย่างรวดเร็วสู่ระดับต่ำสุดที่ 114,397 Bitcoin ร่วงลงเกือบ $5,000

Dimitrios Zappas 07:50 2025-08-01 UTC+2

สัญญาณการซื้อขายสำหรับทองคำ (XAU/USD) สำหรับวันที่ 1-4 สิงหาคม 2025: ซื้อเหนือ $3,281 (21 SMA - 4/8 Murray)

ทองคำกำลังซื้อขายอยู่ที่ประมาณ 3,292 โดยดีดตัวขึ้นเหนือระดับ 4/8 ของ Murray และกำลังสร้างรูปแบบทางเทคนิคที่เรียกว่า pennant หากราคาทะลุเหนือ 3,396 หรือแม้กระทั่งมีการยืนยันเหนือ 21 SMA อาจเป็นสัญญาณเริ่มต้นของรอบขาขึ้น หากทองคำได้รับการสนับสนุนอย่างแข็งแกร่งบริเวณระดับ

Dimitrios Zappas 07:47 2025-08-01 UTC+2

การคาดการณ์ค่าเงินยูโร/ดอลลาร์สหรัฐ สำหรับวันที่ 1 สิงหาคม 2025

เมื่อวานนี้ ตลาดได้เห็นการถอยห่างจากสินทรัพย์ที่มีความเสี่ยง: ดัชนี S&P 500 ลดลง 0.37%, ดัชนีดอลลาร์สหรัฐเพิ่มขึ้น 0.16% และราคาน้ำมันลดลง 0.90% อัตราผลตอบแทนพันธบัตรรัฐบาลยังคงอยู่ในช่วงของวันจันทร์ โดยมีความสมดุลด้วยการหลีกเลี่ยงความเสี่ยงและการคาดการณ์ถึงอัตราดอกเบี้ยที่สูงอย่างต่อเนื่อง สิ่งที่น่าสังเกตมากขึ้นคือ การเพิ่มขึ้น

Laurie Bailey 04:52 2025-08-01 UTC+2

การคาดการณ์ GBP/USD สำหรับวันที่ 1 สิงหาคม 2025

เมื่อวานนี้ เงินปอนด์อังกฤษเคลื่อนไหวอยู่ภายในช่วงที่คาดไว้ระหว่าง 1.3206–1.3265 และปิดตลาดด้วยแท่งเทียนสีดำ ขณะที่วันนี้เปิดตลาดต่ำกว่าขอบล่างของช่วงดังกล่าว เป้าหมายที่ 1.3090 ตอนนี้จึงเปิดสู่สถานะที่เป็นไปได้ หากข้อมูลการจ้างงานของสหรัฐฯ ในวันนี้ไม่ทำให้ผิดหวัง — โดยคาดว่าจะมีการเพิ่มงานนอกภาคเกษตร 106,000 ตำแหน่งในเดือนกรกฎาคม —

Laurie Bailey 04:50 2025-08-01 UTC+2

การคาดการณ์ EUR/JPY สำหรับวันที่ 1 สิงหาคม 2025

คู่สกุลเงิน EUR/JPY ได้ร่วงลงอย่างชัดเจนจากขอบบนของช่องราคาพร้อมกันกับที่ออสซิลเลเตอร์ Marlin ได้เข้าสู่พื้นที่ลบ (กราฟรายวัน) เมื่อวานนี้ ราคาได้เด้งกลับจากแนวสนับสนุนของเส้นสมดุล ขณะนี้ ราคาดูเหมือนจะเตรียมตัวพยายามครั้งใหม่เพื่อทะลวงผ่านระดับแนวรับที่ 169.30 ซึ่งได้รับการเสริมพลังจากเส้น MACD (ค่าเฉลี่ยเคลื่อนที่สีฟ้า) การหลุดต่ำกว่าแนวรับนี้จะเปิดทางไปยังช่วงเป้าหมาย

Laurie Bailey 04:42 2025-08-01 UTC+2
หากไม่สะดวกคุยในตอนนี้
ระบุคำถามไว้ได้ใน แชท.
Widget callback
 

Dear visitor,

Your IP address shows that you are currently located in the USA. If you are a resident of the United States, you are prohibited from using the services of InstaFintech Group including online trading, online transfers, deposit/withdrawal of funds, etc.

If you think you are seeing this message by mistake and your location is not the US, kindly proceed to the website. Otherwise, you must leave the website in order to comply with government restrictions.

Why does your IP address show your location as the USA?

  • - you are using a VPN provided by a hosting company based in the United States;
  • - your IP does not have proper WHOIS records;
  • - an error occurred in the WHOIS geolocation database.

Please confirm whether you are a US resident or not by clicking the relevant button below. If you choose the wrong option, being a US resident, you will not be able to open an account with InstaForex anyway.

We are sorry for any inconvenience caused by this message.