empty
05.12.2023 03:34 PM
BITCOIN: Technical analysis of the situation

This image is no longer relevant

Higher timeframes

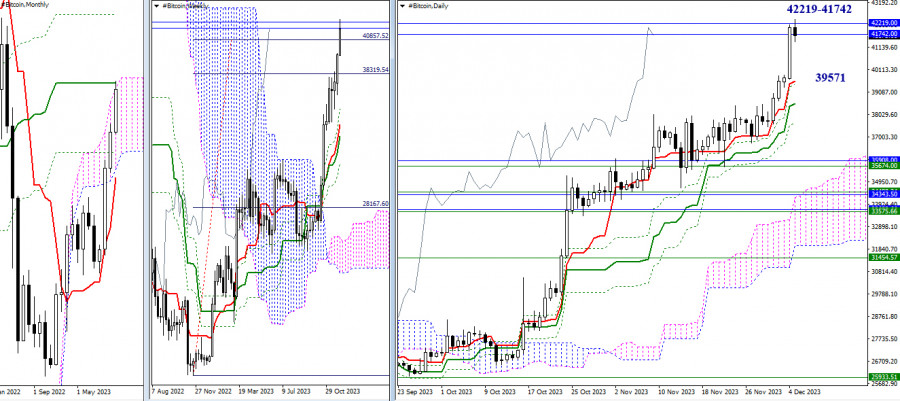
In November, Bitcoin slowly but steadily continued to rise. At the beginning of December, the upward momentum of market participants intensified. As a result, they not only achieved the weekly target of 40,857.52 (100% retracement) but also reached the confluence of monthly resistances at 42,219 – 41,742 (medium-term trend + upper boundary of the cloud). Breaking through these resistances and securely establishing in the bullish zone relative to the monthly cloud will significantly expand the upside potential for market participants. The next upward target will be the final level of the death cross of the monthly Ichimoku cloud (48,530), and in addition, a breakout target above the monthly cloud will be formed.

Failure to overcome these crucial and strong resistances may lead to the formation of a rebound and the initiation of a corrective decline. The daily timeframe will be the first to respond to this, with correction targets being the supports of the golden cross of the daily Ichimoku cloud, currently located at 39,571 (Tenkan) and 38,548 (Kijun). Next, for the development of a downward correction, the supports of the weekly golden cross will be considered, the nearest of which are currently at 35,674 and 34,472, with reinforcement from monthly support levels at 35,908 and 34,371.

This image is no longer relevant

H4 – H1

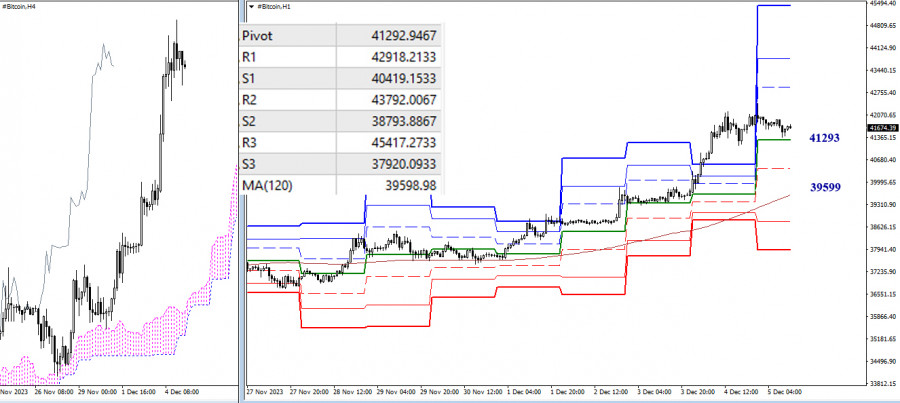
Bulls now have the main advantage on the lower timeframes. However, the pair has been in a corrective zone for a long time. Exiting the zone (42,424) will refocus the market's attention on bullish targets. Intraday bullish targets are represented by the resistances of classic pivot points (42,918 – 43,792 – 45,417). If the corrective decline receives a new impetus, the first tasks for bearish market participants will be testing and breaking through key levels at 41,293 (central pivot point of the day) and 39,599 (weekly long-term trend), with additional support from S1 (40,419). If consolidation below and a reversal of the movement occur, it will allow bearish market participants to change the current balance of power and strengthen their positions, also creating new bearish prospects as a result.

***

The technical analysis of the situation uses:

Higher timeframes - Ichimoku Kinko Hyo (9.26.52) + Fibo Kijun levels

H1 - Pivot Points (classic) + Moving Average 120 (weekly long-term trend)

Summary
Urgency
Analytic
Zhizhko Nadezhda
Start trade
รับผลกำไรจากการเปลี่ยนแปลงอัตราสกุลเงินดิจิทัลกับ InstaForex.
ดาวน์โหลด MetaTrader 4 และเปิดการซื้อขายครั้งแรกของคุณ.
  • Grand Choice
    Contest by
    InstaForex
    InstaForex always strives to help you
    fulfill your biggest dreams.
    เข้าร่วมการแข่งขัน


บทความแนะนำ

USD/JPY: การวิเคราะห์และการคาดการณ์

คู่เงิน USD/JPY ยังคงอยู่ในช่วงการปรับตัวใกล้ระดับสูงในรอบสามสัปดาห์ ซึ่งได้รับการสนับสนุนจากความแข็งแกร่งของดอลลาร์สหรัฐและสัญญาณในตลาดที่ผสมกัน ดอลลาร์ได้รับแรงหนุนจากคำขู่ของประธานาธิบดี Donald Trump ของสหรัฐอเมริกาในการกำหนดภาษีนำเข้าสูงถึง 30% จากเม็กซิโกและสหภาพยุโรปตั้งแต่วันที่ 1 สิงหาคม ซึ่งส่งผลให้ความต้องการเงินที่เป็นที่ปลอดภัย เช่น เงินเยนญี่ปุ่น

Irina Yanina 12:17 2025-07-14 UTC+2

วิเคราะห์ทางเทคนิคสำหรับสัปดาห์วันที่ 14–19 กรกฎาคม: คู่สกุลเงิน GBP/USD

การวิเคราะห์แนวโน้ม ในสัปดาห์นี้จากระดับ 1.3487 (ราคาปิดของกราฟแท่งเทียนรายสัปดาห์ครั้งที่ผ่านมา) ราคามีแนวโน้มที่จะลดลงต่อเนื่องไปยังเป้าหมายที่ 1.3374 — ซึ่งเป็นระดับการถอยกลับ 23.6% (เส้นประสีแดง) เมื่อทดสอบระดับนี้แล้ว ราคาอาจเริ่มเคลื่อนตัวขึ้นไปยังเป้าหมายที่ 1.3420 — ค่าเฉลี่ยเคลื่อนที่เชิงเส้นแบบทวีผู้หนัก

Stefan Doll 11:40 2025-07-14 UTC+2

การวิเคราะห์ทางเทคนิคสำหรับสัปดาห์ที่ 14–19 กรกฎาคม: คู่สกุลเงิน EUR/USD

การวิเคราะห์แนวโน้ม (รูปที่ 1) สัปดาห์นี้ จากระดับ 1.1689 (ราคาปิดของแท่งเทียนรายสัปดาห์ก่อนหน้า) ตลาดอาจเคลื่อนตัวลงต่อ โดยมีเป้าหมายที่ระดับ 1.1536 ซึ่งเป็นระดับการย่อตัว 38.2% (เส้นประสีน้ำเงิน) เมื่อทดสอบระดับนี้แล้ว ราคาอาจเริ่มปรับตัวขึ้นสู่เป้าหมายที่

Stefan Doll 11:34 2025-07-14 UTC+2

การคาดการณ์สำหรับ EUR/USD ในวันที่ 14 กรกฎาคม 2025

ในวันศุกร์คู่เงิน EUR/USD ฟื้นตัวจากระดับการปรับฐาน Fibonacci ที่ 127.2% ที่ 1.1712 แล้วหันกลับมาในทิศทางที่ได้เปรียบต่อดอลลาร์สหรัฐ และกลับมาลดลงต่อไปยังระดับ 1.1645 การฟื้นตัวจากระดับนี้จะสนับสนุนการกลับมาในทิศทางที่ได้เปรียบต่อยูโรและเพิ่มขึ้นปานกลางไปจนถึงระดับ 1.1712 การปิดระดับที่ต่ำกว่า 1.1645

Samir Klishi 11:31 2025-07-14 UTC+2

การคาดการณ์สำหรับ GBP/USD ณ วันที่ 14 กรกฎาคม 2025

ในกราฟรายชั่วโมง คู่เงิน GBP/USD เมื่อวันศุกร์มีการแกว่งตัวต่ำกว่าระดับ Fibonacci 127.2% ที่ระดับ 1.3527 และต่อมาได้ลดลงอย่างต่อเนื่องไปยังระดับการแก้ไขลำดับถัดไปที่ 100.0% ที่ระดับ 1.3444 การฟื้นตัวจากระดับนี้จะส่งผลดีต่อปอนด์อังกฤษ โดยบ่งชี้ว่าอาจมีการปรับตัวขึ้นอย่างเหมาะสมไปยังระดับ 1.3527

Samir Klishi 11:25 2025-07-14 UTC+2

ค่าเงินปอนด์ยังคงมีโอกาสที่จะปรับตัวลงไปถึงระดับแนวรับในวันจันทร์ที่ 14 กรกฎาคม 2025 ต่อไปได้

GBP/USD – วันจันทร์ที่ 14 กรกฎาคม 2025 ค่าเงิน GBP/USD กำลังอยู่ในสภาวะที่อ่อนแอ ซึ่งยืนยันได้จากการเคลื่อนไหวของราคาที่อยู่ต่ำกว่าเส้นค่าเฉลี่ยเคลื่อนที่ 50 วัน (50-EMA) และยังอยู่ต่ำกว่าเส้นค่าเฉลี่ยเคลื่อนที่

Arief Makmur 07:21 2025-07-14 UTC+2

คู่สกุลเงินสินค้าโภคภัณฑ์ USD/CAD มีแนวโน้มที่จะปรับตัวไปยังจุดหมุนในวันนี้ วันจันทร์ที่ 14 กรกฎาคม 2025

USD/CAD, 14 กรกฎาคม 2025 แม้ว่า Lonnie จะปรับตัวในทิศทางที่เป็นกลาง-ลาดขึ้น แต่ก็ยังมีโอกาสที่คู่สกุลเงิน USD/CAD จะทดสอบระดับ Pivot และแนวรับในวันนี้ ระดับสำคัญ 1. แนวต้าน

Arief Makmur 07:21 2025-07-14 UTC+2

การคาดการณ์ EUR/USD สำหรับวันที่ 14 กรกฎาคม 2025

แท่งเทียนของวันศุกร์สำหรับคู่สกุลเงิน EUR/USD ปิดในลักษณะขาลง โดยราคาปรับฐานต่ำกว่าระดับเส้น MACD รายวัน เป้าหมายสำหรับวันนี้คือการปิดที่ต่ำกว่าระดับ 1.1692 เพื่อให้บรรลุเป้าหมายนี้ แท่งเทียนรายวันต้องปิดต่ำกว่าระดับดังกล่าว ทั้งนี้ ตัวบ่งชี้ Marlin ยังไม่เข้าสู่โซนลบ แต่คาดว่าจะทำได้ในวันพรุ่งนี้

Laurie Bailey 05:31 2025-07-14 UTC+2

การพยากรณ์ GBP/USD สำหรับวันที่ 14 กรกฎาคม 2025

เมื่อวันศุกร์ที่ผ่านมา เงินปอนด์ของอังกฤษอ่อนค่าลงกว่า 80 pips โดยลดลงต่ำกว่าระดับสมดุลรายวันและระดับสัญญาณสำคัญที่ 1.3510 การลดลงนี้ถูกกระตุ้นจากข้อมูล GDP และการผลิตอุตสาหกรรมที่อ่อนแอ การประมาณการ GDP ในเดือนพฤษภาคมแสดงให้เห็นว่า -0.1% เทียบกับที่คาดการณ์ไว้ที่ +0.1%

Laurie Bailey 05:31 2025-07-14 UTC+2

พยากรณ์ AUD/USD สำหรับวันที่ 14 กรกฎาคม 2025

บนกราฟรายวัน คู่เงิน AUD/USD อยู่ระหว่างเส้น MACD (0.6551) และขอบบนของช่องราคาท้องถิ่น (สีน้ำเงิน, 0.6597) การฝ่าเส้นระดับใดระดับหนึ่งจะแสดงถึงความตั้งใจของราคาที่จะไปต่อในทิศทางที่เลือก อย่างไรก็ตาม สำหรับเป้าหมายด้านบวก ระดับ 0.6650 นั้นใกล้เคียงมาก

Laurie Bailey 05:31 2025-07-14 UTC+2
หากไม่สะดวกคุยในตอนนี้
ระบุคำถามไว้ได้ใน แชท.
Widget callback
 

Dear visitor,

Your IP address shows that you are currently located in the USA. If you are a resident of the United States, you are prohibited from using the services of InstaFintech Group including online trading, online transfers, deposit/withdrawal of funds, etc.

If you think you are seeing this message by mistake and your location is not the US, kindly proceed to the website. Otherwise, you must leave the website in order to comply with government restrictions.

Why does your IP address show your location as the USA?

  • - you are using a VPN provided by a hosting company based in the United States;
  • - your IP does not have proper WHOIS records;
  • - an error occurred in the WHOIS geolocation database.

Please confirm whether you are a US resident or not by clicking the relevant button below. If you choose the wrong option, being a US resident, you will not be able to open an account with InstaForex anyway.

We are sorry for any inconvenience caused by this message.