


сила сигнала 1 из 5

По GBPAUD на M5 сформировалась фигура «Бычий симметричный треугольник». Нижняя граница фигуры имеет координаты 2.0825/2.0852, при этом верхняя граница 2.0880/2.0852. Формирование фигуры «Бычий симметричный треугольник» наиболее вероятным образом свидетельствует о продолжении восходящего тренда. Это означает, что курс GBPAUD, в случае срабатывания фигуры, пробьет верхнюю границу и направится к значению 2.0867.
Таймфреймы М5 и М15 могут иметь больше ложных точек входа.
- Все
- Вымпел
- Голова и плечи
- Двойная вершина
- Прямоугольник
- Треугольник
- Тройная вершина
- Флаг
- Все
- #AAPL
- #AMZN
- #Bitcoin
- #EBAY
- #FB
- #GOOG
- #INTC
- #KO
- #MA
- #MCD
- #MSFT
- #NTDOY
- #PEP
- #TSLA
- #TWTR
- AUDCAD
- AUDCHF
- AUDJPY
- AUDUSD
- EURCAD
- EURCHF
- EURGBP
- EURJPY
- EURNZD
- EURRUB
- EURUSD
- GBPAUD
- GBPCHF
- GBPJPY
- GBPUSD
- GOLD
- NZDCAD
- NZDCHF
- NZDJPY
- NZDUSD
- SILVER
- USDCAD
- USDCHF
- USDJPY
- USDRUB
- Все
- M5
- M15
- M30
- H1
- D1
- Все
- Покупка
- Продажа
- Все
- 1
- 2
- 3
- 4
- 5

According to the chart of M30, #Bitcoin formed the Bearish Rectangle. This type of a pattern indicates a trend continuation. It consists of two levels: resistance 96456.78 - 0.00
Open chart in a new window
The Double Bottom pattern has been formed on #Bitcoin M15. This formation signals a reversal of the trend from downwards to upwards. The signal is that a buy trade should
The M5 and M15 time frames may have more false entry points.
Open chart in a new window
The Double Bottom pattern has been formed on #Bitcoin M30; the upper boundary is 97860.25; the lower boundary is 96258.44. The width of the pattern is 156618 points. In case
Open chart in a new window
The Double Bottom pattern has been formed on #Bitcoin M5; the upper boundary is 96467.62; the lower boundary is 96258.44. The width of the pattern is 20692 points. In case
The M5 and M15 time frames may have more false entry points.
Open chart in a new window
The Triple Bottom pattern has been formed on EURGBP M5. It has the following characteristics: resistance level 0.8515/0.8514; support level 0.8509/0.8509; the width is 6 points. In the event
The M5 and M15 time frames may have more false entry points.
Open chart in a new window
The Double Top reversal pattern has been formed on USDJPY M5. Characteristics: the upper boundary 145.09; the lower boundary 144.90; the width of the pattern is 18 points. Sell trades
The M5 and M15 time frames may have more false entry points.
Open chart in a new window
The Triple Bottom pattern has been formed on EURGBP M5. It has the following characteristics: resistance level 0.8515/0.8514; support level 0.8509/0.8509; the width is 6 points. In the event
The M5 and M15 time frames may have more false entry points.
Open chart in a new window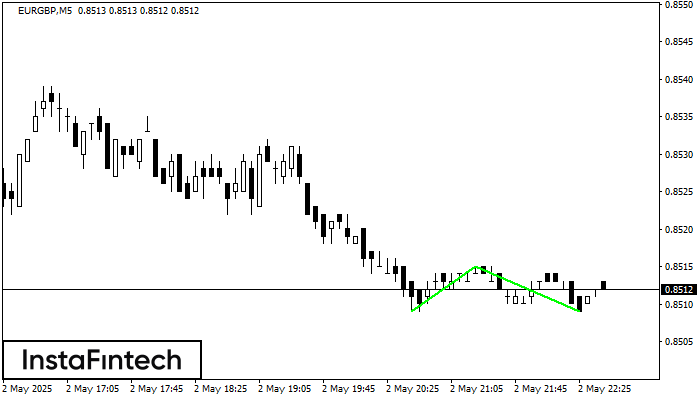
The Double Bottom pattern has been formed on EURGBP M5; the upper boundary is 0.8515; the lower boundary is 0.8509. The width of the pattern is 6 points. In case
The M5 and M15 time frames may have more false entry points.
Open chart in a new window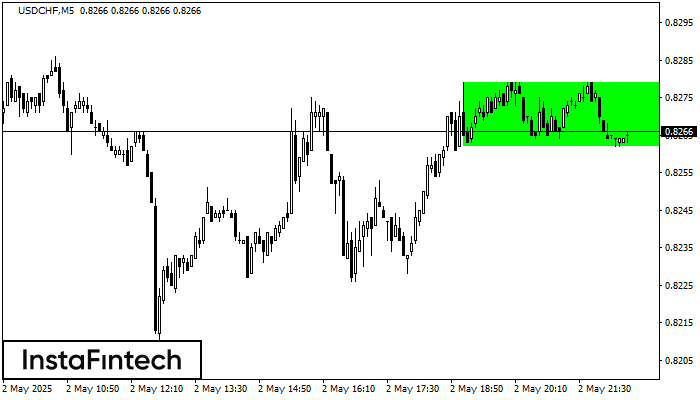
According to the chart of M5, USDCHF formed the Bullish Rectangle. The pattern indicates a trend continuation. The upper border is 0.8279, the lower border is 0.8262. The signal means
The M5 and M15 time frames may have more false entry points.
Open chart in a new window


