empty
24.03.2023 10:21 AM
EUR/USD and GBP/USD: trading plan for beginners on March 24, 2023

Macroeconomic calendar from March 23

At a monetary policy meeting yesterday, the Bank of England raised interest rates by 25 basis points to 4.25%, the highest rates since October 2008. Back then, interest rates were at 4.50%. The increase came due to persistent inflation. In February and January, consumer prices accelerated to 10.4% and 10.1% respectively. Meanwhile, economists had expected inflation to slow down in February. However, the latest press release hints at a possible end of the tightening cycle in the near term. So, it may be that we will soon see the regulator pause tightening.

Overview of technical charts from March 23

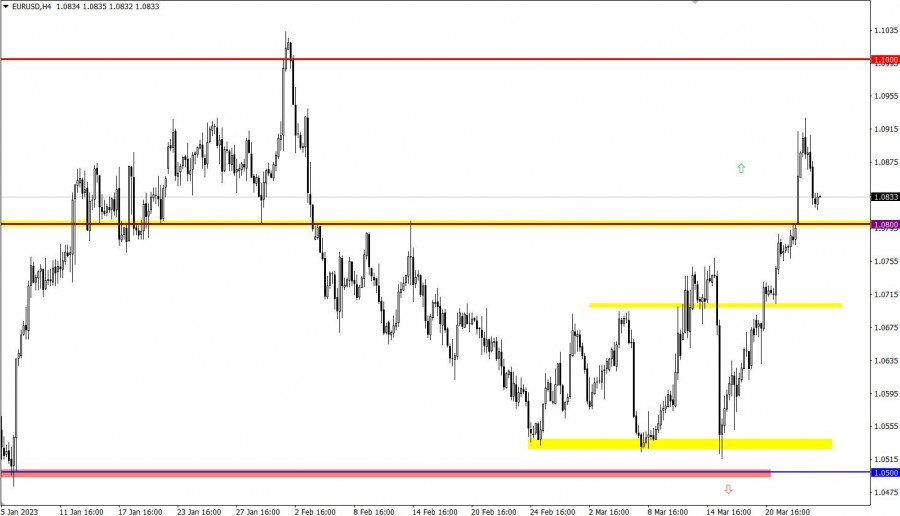
EUR/USD has gained over 250 pips since the beginning of the week. That triggered a horizontal movement with a signal to buy EUR. The volume of long positions decreased and the price retreated.

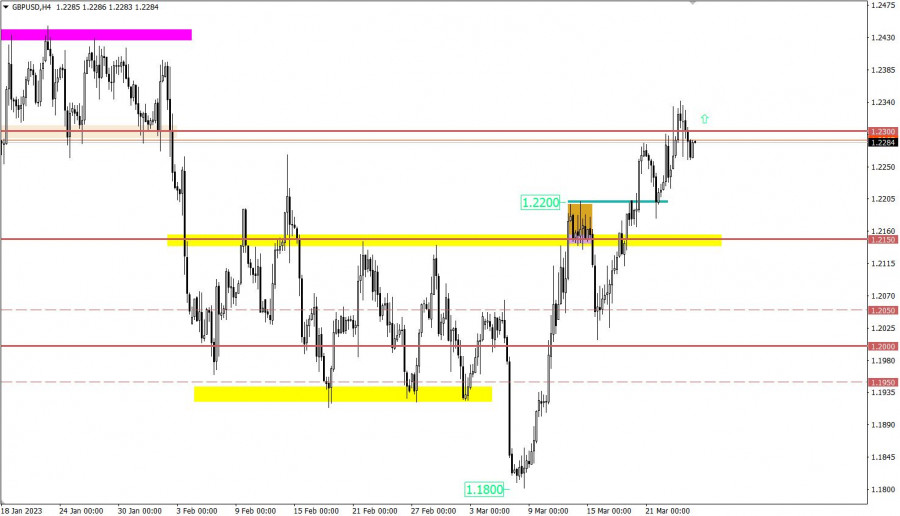
Once 1.2300 resistance was reached, GBP/USD pulled back somewhat. Nevertheless, the bull trend goes on. The pound has recouped almost all losses incurred in February.

This image is no longer relevant

Macroeconomic calendar on March 24

With the opening of European trade, UK retail sales came in, showing a rise to -3.5% versus -5.4% year-on-year. On a monthly basis, figures grew by 1.2%.

Today, a series of business activity reports will be delivered in the eurozone, the United States, and the United Kingdom. Economists expect figures to decline across the board.

Trading plan for EUR/USD on March 24

EUR/USD retreated to 1.0800 support. The price may rebound from this mark with a rise in buying volumes.

Alternatively, EUR/USD may go down if quotes stay below 1.0800 intraday.

This image is no longer relevant

Trading plan for GBP/USD on March 24

A pullback may cause a shift in sentiment. Should the price go above 1.2300, it would generate a signal to buy GBP. This could lead to a bullish continuation, and the pair could update the swing high of the medium-term trend.

Alternatively, if quotes fall below 1.2200, it will mark the rise of a downtrend.

This image is no longer relevant

What's on technical charts

The candlestick chart shows graphical white and black rectangles with upward and downward lines. While conducting a detailed analysis of each individual candlestick, it is possible to notice its features intrinsic to a particular time frame: the opening price, the closing price, and the highest and lowest price.

Horizontal levels are price levels, in relation to which a stop or reversal of the price may occur. They are called support and resistance levels.

Circles and rectangles are highlighted examples where the price reversed in the course of its history. This color highlighting indicates horizontal lines which can exert pressure on prices in the future.

Upward/downward arrows signal a possible future price direction.

Gven Podolsky,
Chuyên gia phân tích của InstaForex
© 2007-2025
Summary
Urgency
Analytic
Vladislav Tukhmenev
Start trade
Kiếm lợi nhuận từ những biến đổi giá của tiền điện tử với InstaForex.
Tải MetaTrader 4 và mở giao dịch đầu tiên của bạn.
  • Grand Choice
    Contest by
    InstaForex
    InstaForex always strives to help you
    fulfill your biggest dreams.
    THAM GIA CUỘC THI

Các bài báo được đề xuất

Làm thế nào để giao dịch GBP/USD vào ngày 11 tháng 7? Mẹo đơn giản và phân tích giao dịch cho người mới bắt đầu

Đánh giá giao dịch thứ Năm: GBP/USD, Biểu đồ 1H Vào thứ Năm, cặp GBP/USD tiếp tục di chuyển giảm, phản ánh các động thái của cặp EUR/USD. Hành

Paolo Greco 08:43 2025-07-11 UTC+2

Cách giao dịch EUR/USD vào ngày 11 tháng 7? Mẹo đơn giản và đánh giá giao dịch cho người mới bắt đầu

Vào thứ Năm, cặp tiền tệ EUR/USD tiếp tục dịch chuyển nhẹ xuống dưới theo xu hướng hiện tại. Chúng tôi đã nói điều tương tự suốt cả tuần

Paolo Greco 08:36 2025-07-11 UTC+2

Đề xuất giao dịch và Đánh giá giao dịch EUR/USD ngày 11 tháng 7

Phân Tích EUR/USD Khung 5 Phút Vào thứ Năm, cặp tiền tệ EUR/USD tiếp tục xu hướng giảm chậm chạp, hoàn toàn bỏ qua bối cảnh

Paolo Greco 08:19 2025-07-11 UTC+2

Khuyến nghị giao dịch EUR/USD và Đánh giá giao dịch cho ngày 11 tháng 7

Vào thứ Năm, cặp tiền tệ EUR/USD tiếp tục suy giảm chậm chạp, hoàn toàn bỏ qua bối cảnh cơ bản. Như đã biết, tuần này Donald Trump đã công

Paolo Greco 06:25 2025-07-11 UTC+2

Cách giao dịch cặp tiền tệ GBP/USD vào ngày 10 tháng 7: Mẹo đơn giản và phân tích giao dịch cho người mới bắt đầu

GBP/USD – Biểu Đồ 1 Giờ Vào thứ Tư, cặp tiền tệ GBP/USD cũng mắc kẹt trong một chuyển động ngang, với độ biến động rất thấp. Không có chuyển

Paolo Greco 08:56 2025-07-10 UTC+2

Cách giao dịch cặp tiền tệ EUR/USD vào ngày 10 tháng 7: Mẹo đơn giản và phân tích giao dịch cho người mới bắt đầu

EUR/USD – Biểu Đồ 1 Giờ Vào thứ Tư, cặp EUR/USD tiếp tục giao dịch theo xu hướng đang diễn ra từ tuần trước. Hoạt động thị trường trong ngày

Paolo Greco 08:48 2025-07-10 UTC+2

Khuyến nghị giao dịch và đánh giá phiên giao dịch GBP/USD ngày 10 tháng 7

Vào thứ Tư, cặp GBP/USD vẫn nằm trong kênh xu hướng giảm của nó. Tuy nhiên, một thiết lập thú vị hơn đã xuất hiện trên khung thời gian

Paolo Greco 06:57 2025-07-10 UTC+2

Khuyến nghị giao dịch và Đánh giá giao dịch cho EUR/USD vào ngày 10 tháng 7

Vào thứ Tư, cặp tiền EUR/USD tiếp tục di chuyển trong một kênh giảm yếu như dự báo trước đây. Tuy nhiên, biến động giảm đến mức tối thiểu, không

Paolo Greco 06:45 2025-07-10 UTC+2

Cách giao dịch cặp tiền tệ GBP/USD vào ngày 9 tháng 7: Mẹo đơn giản và phân tích giao dịch dành cho người mới bắt đầu

Vào thứ Ba, cặp GBP/USD tiếp tục chuyển động giảm nhẹ, điều này rõ ràng có tính chất kỹ thuật và điều chỉnh

Paolo Greco 08:46 2025-07-09 UTC+2

Làm thế nào để giao dịch cặp tiền tệ EUR/USD vào ngày 9 tháng 7? Mẹo đơn giản và phân tích giao dịch cho người mới bắt đầu

Vào thứ Ba, cặp tiền tệ EUR/USD tiếp tục xu hướng giảm nhẹ theo xu hướng chung. Sau một đợt tăng giá khá mạnh, thị trường bắt đầu điều chỉnh

Paolo Greco 08:28 2025-07-09 UTC+2
Không thể nói chuyện ngay bây giờ?
Đặt câu hỏi của bạn trong phần trò chuyện.
Widget callback
 

Dear visitor,

Your IP address shows that you are currently located in the USA. If you are a resident of the United States, you are prohibited from using the services of InstaFintech Group including online trading, online transfers, deposit/withdrawal of funds, etc.

If you think you are seeing this message by mistake and your location is not the US, kindly proceed to the website. Otherwise, you must leave the website in order to comply with government restrictions.

Why does your IP address show your location as the USA?

  • - you are using a VPN provided by a hosting company based in the United States;
  • - your IP does not have proper WHOIS records;
  • - an error occurred in the WHOIS geolocation database.

Please confirm whether you are a US resident or not by clicking the relevant button below. If you choose the wrong option, being a US resident, you will not be able to open an account with InstaForex anyway.

We are sorry for any inconvenience caused by this message.